We scraped the ads from 1,062 B2B startups that raised a Series A. Here's how they run ads.
We took every US company selling to businesses that raised a Series A since September 2024, 2,010 of them, and looked each one up in the Google, Meta and LinkedIn ad libraries. 52.8% are running ads. We pulled 35,132 of them, labelled the creative and rendered the landing pages, so this is a handbook rather than a survey.
The short version
- 52.8% of US B2B startups that raised a Series A are running ads (1,062 of 2,010). We pulled 35,132 of their ads.
- LinkedIn is their biggest channel, not Google: 39.9% run LinkedIn ads against 37.3% on Google and 5.3% on Meta, and more of them use LinkedIn alone (14.7%) than use Google alone (11.3%).
- Two thirds of the ads ask for nothing. 69.9% state no offer, and 71.8% of advertisers use "Learn more" as their main button. Only 4.7% lead with a demo request.
- 69.9% of the ads show no product, name no customer and carry no number, and 50.4% do that and ask for nothing as well. 41% of the copy mentions AI.
- The gap between the best-run accounts and the rest is enormous. The best-run quarter keep a median of 44 ads live from 29 different creatives; everyone else runs 6 ads from 4. The playbook at the end is what they do differently.
LinkedIn is their biggest channel, not Google
We took every company that announced a Series A between September 2024 and August 2026, kept the ones headquartered in the United States that sell to other businesses, and looked all 2,010 of them up in the public Google, Meta and LinkedIn ad libraries.
1,062 of them are running ads, 52.8%. We pulled every ad we could reach: 35,132 in all (21,412 on Google, 9,812 on LinkedIn, 3,908 on Meta). Everything below comes from those ads and the pages behind them.
The first surprise is the order. Across all Series A companies worldwide, Google leads. Narrow it to US companies selling to other businesses and LinkedIn comes out on top at 39.9%, with Google at 37.3% and Meta far behind at 5.3%.
14.7% of these companies run LinkedIn ads and nothing else, against 11.3% on Google alone. 533 run both. If you sell software to businesses and you have been treating LinkedIn as the channel you add later, your peers are not.
Meta is nearly absent: 5.3%, and 0.2% use it on its own. The ones who do are mostly selling to small businesses, where the buyer and the consumer are the same person.
Two thirds of the ads ask for nothing
Before the creative, the offer. What does the ad actually ask you to do? For most of them, nothing.
69.9% of the ads state no offer at all. They say what the product does and leave it there. Among the ones that do ask for something, the requests are evenly spread and all small: 6.9% ask you to download something, 6.9% to book a demo, 4.8% to start a free trial, 4% to sign up for the product and 3.2% to register for a webinar.
The buttons say the same thing. Taking each advertiser's most-used button:
71.8% of advertisers lead with "Learn more." 4.7% lead with a demo request and 4.7% with an event registration. The reputation of B2B advertising is that everything is a book-a-demo ad. In this cohort almost nothing is.
Part of that is the platform: LinkedIn's picker opens on "Learn more" and its lead forms pair with it, so the button understates the intent. But an ad that states no offer and asks you to learn more is asking the landing page to do all of the work, and the landing page section below shows how often there is no landing page to speak of.
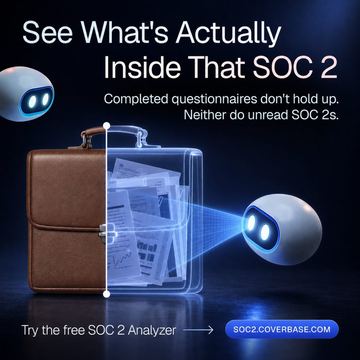
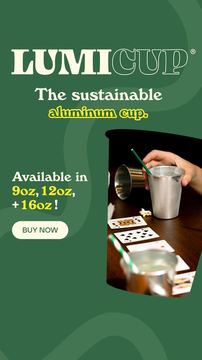
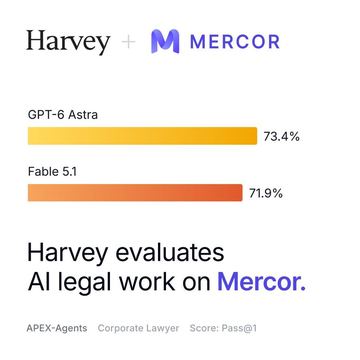
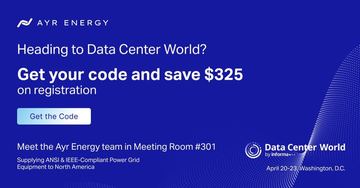
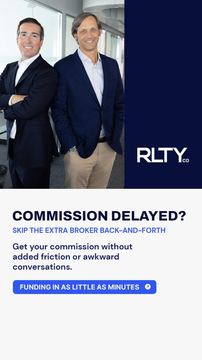
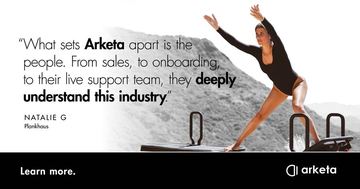
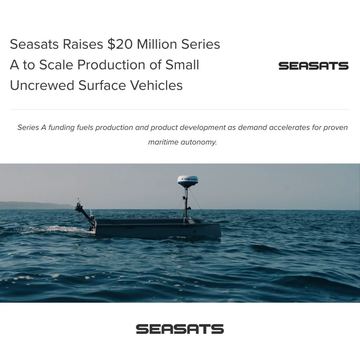
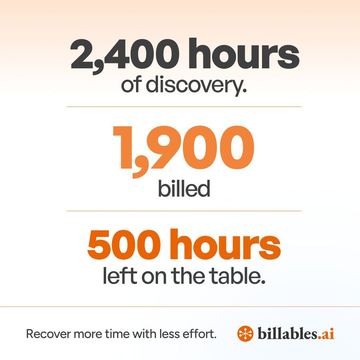
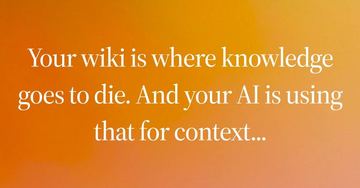
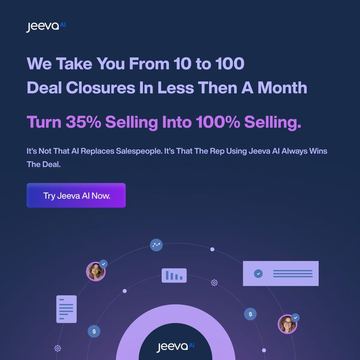
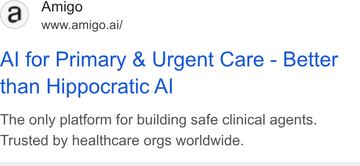
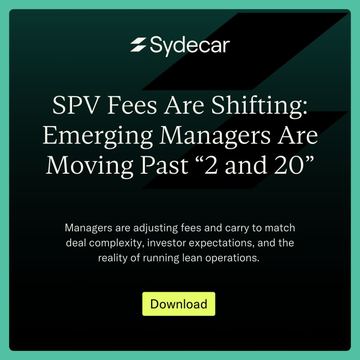
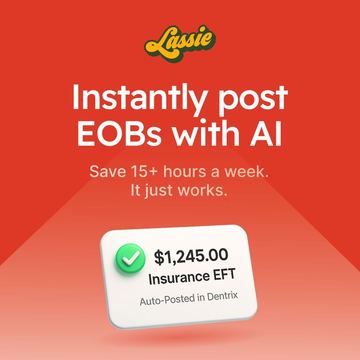
What a B2B ad actually looks like
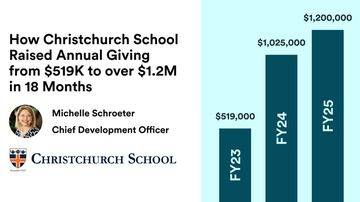
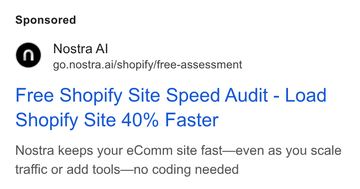
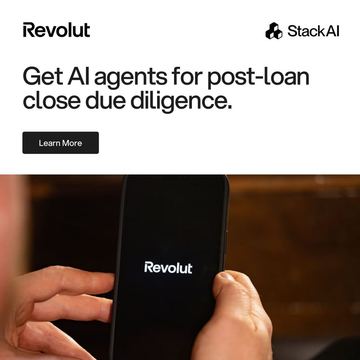
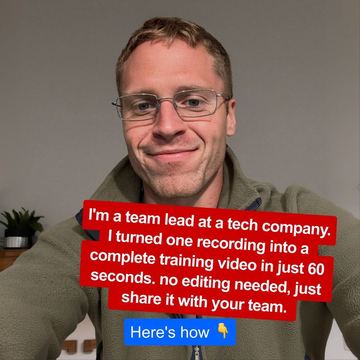
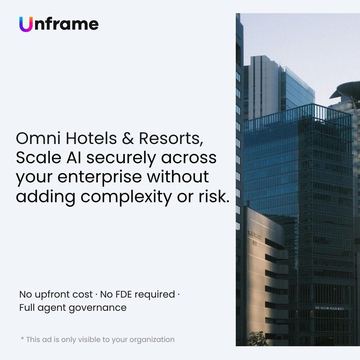
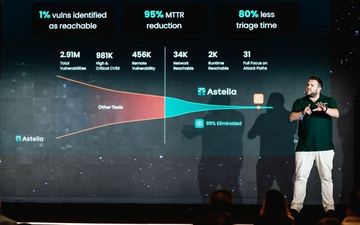
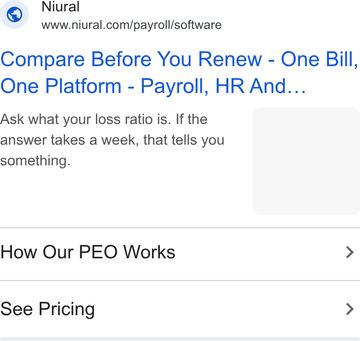
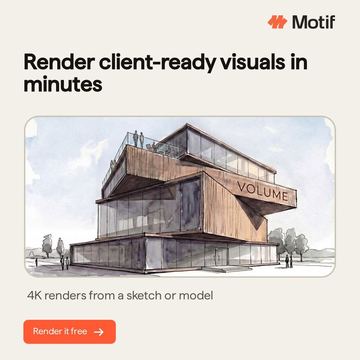
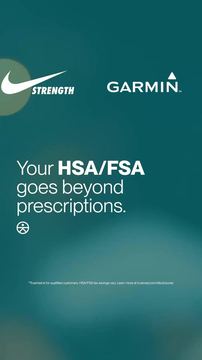
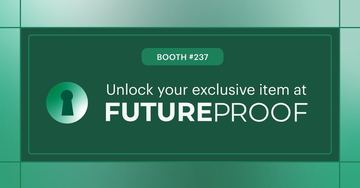
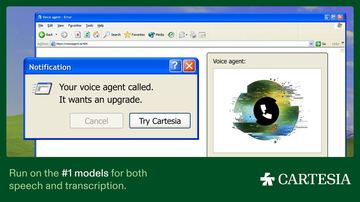
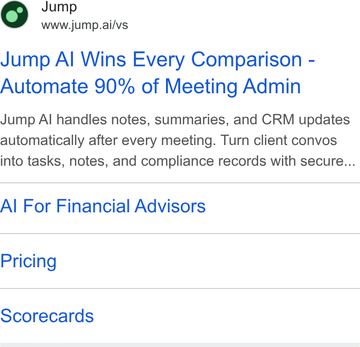
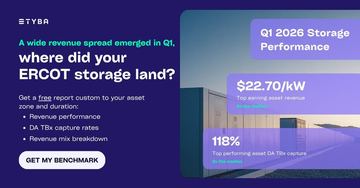
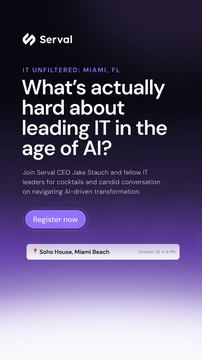
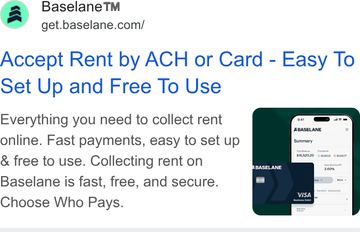
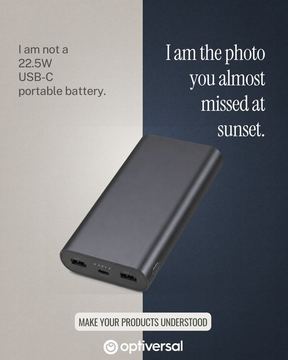
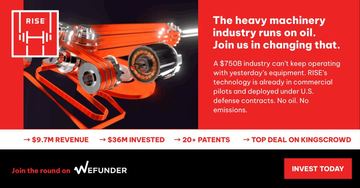
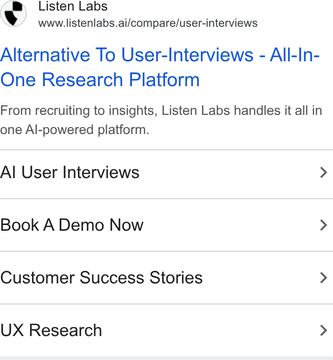
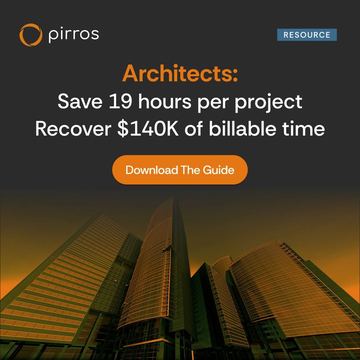
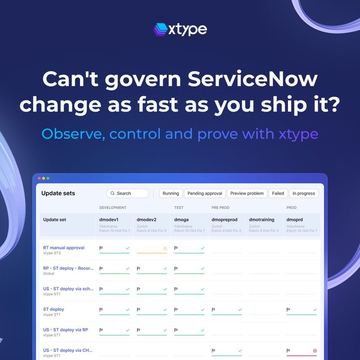
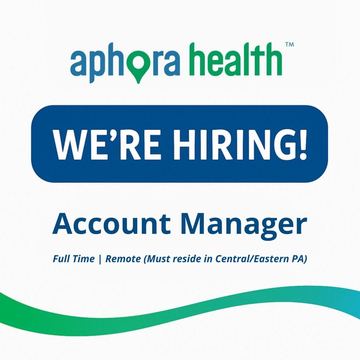
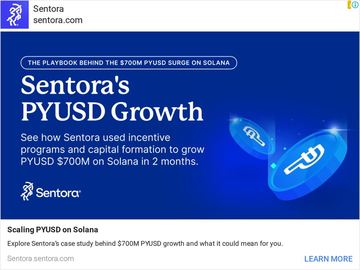
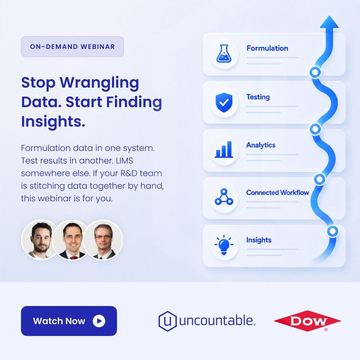
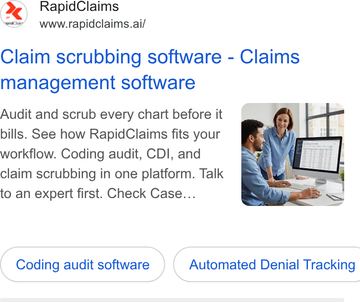
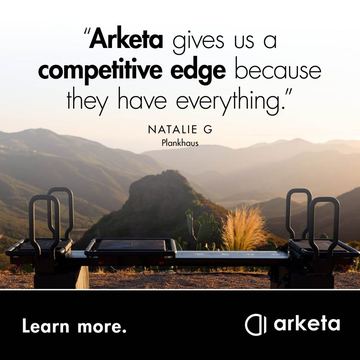
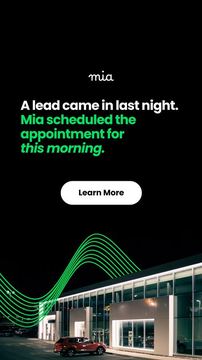
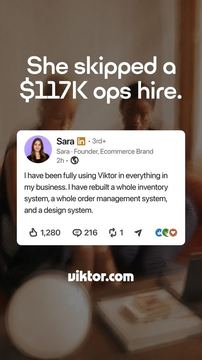
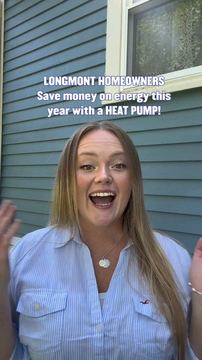
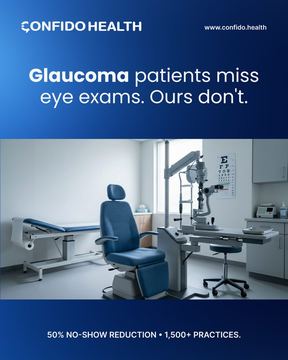
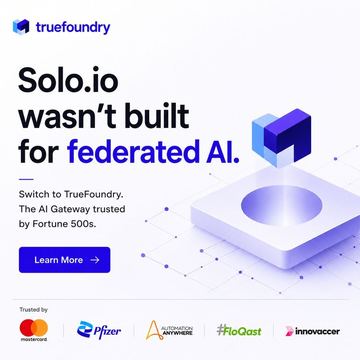
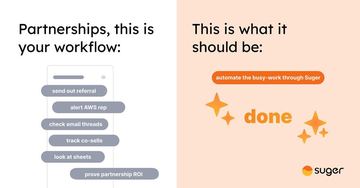
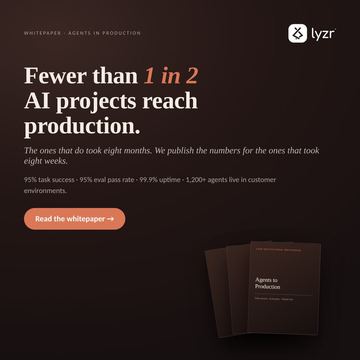
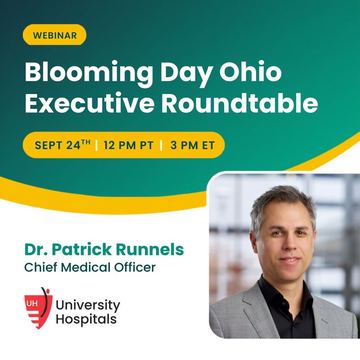
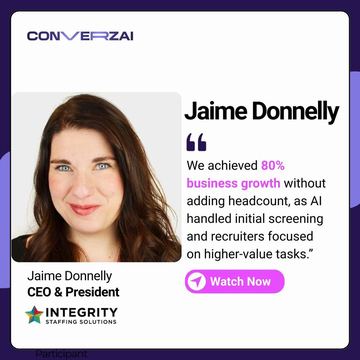
We had a vision model look at 800 of their ad images from 456 companies and say what kind of ad each one is. This is the part nobody publishes, so here is the whole distribution.
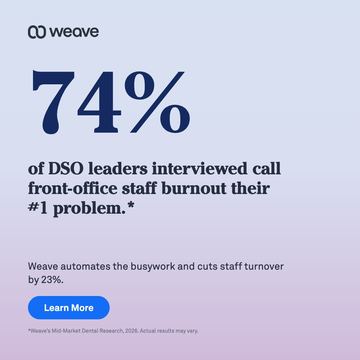
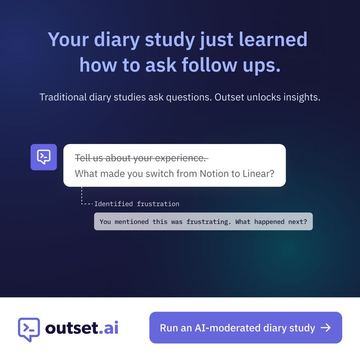
The single biggest group, 52.1%, is a general product or brand message: a claim, a photo or a graphic, with nothing else attached. After that comes a look at the product at 11%, then a statistic at 6.1% and a report or guide at 6.1%.
Put the ingredients together and the gap is stark. 69.9% of these ads show no product, name no customer, carry no logo wall and quote no number. 50.4% of all the ads we looked at do that and ask for nothing on top. On Google, where most creative is display and video stills, it reaches 88.1%; on LinkedIn it is 55.9%.
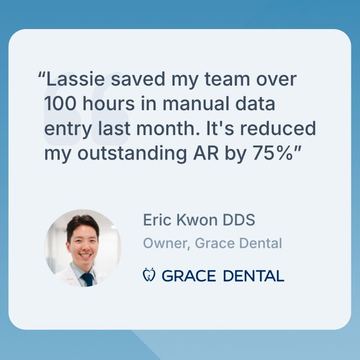
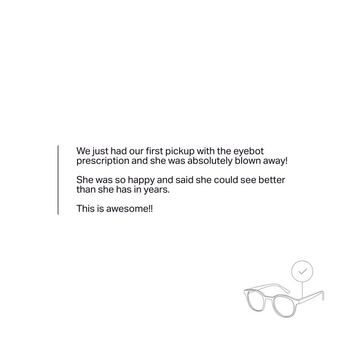
The formats that B2B marketing advice talks about most are the rarest. Customer testimonials are 3.6% of ads. A named customer result or case study is 1.6%. A comparison against a competitor is 4.8%. If you have a happy customer and a number, almost nobody in your peer group is using theirs.
Inside the images: 14.1% show the product interface, 21% show a human face, 7% name a person, 10.6% lead with a number, and only 2.9% show a wall of customer logos. 73.1% of the images carry heavy text, so the image is usually doing the copy's job.
LinkedIn and Google display are used for different jobs. Webinars, reports and events cluster on LinkedIn, where the audience is a job title. Google carries more product and comparison messages, because the person is already searching.
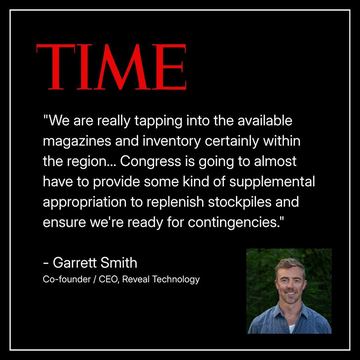
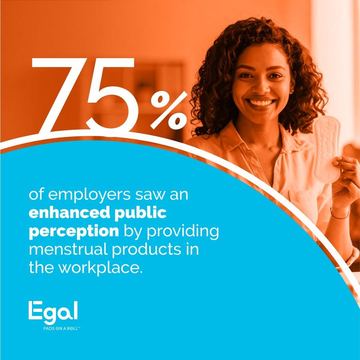

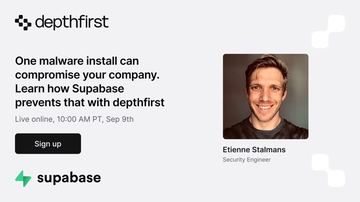
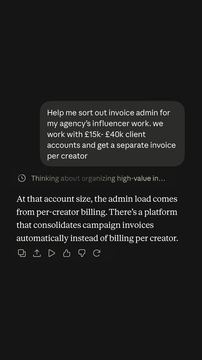
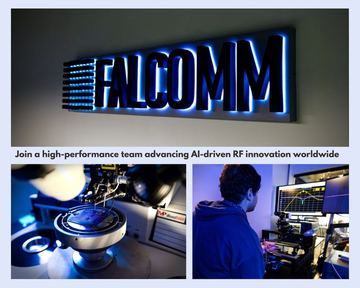
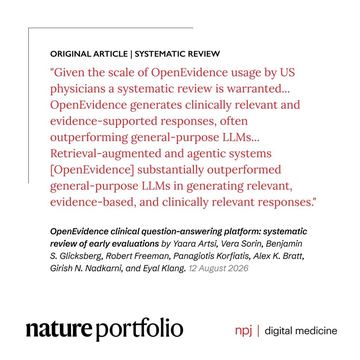
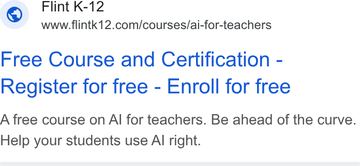
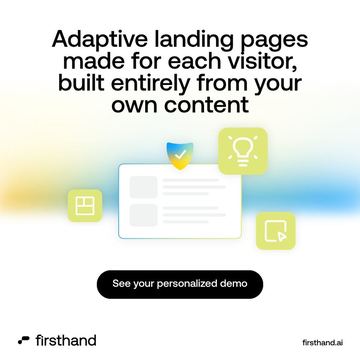

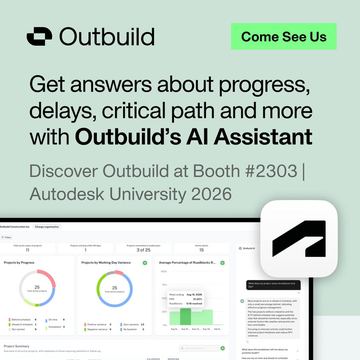
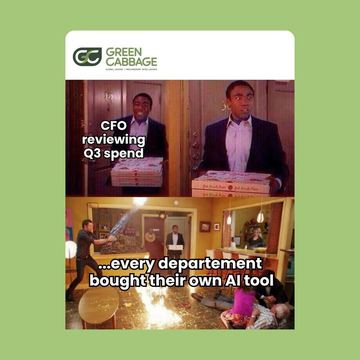
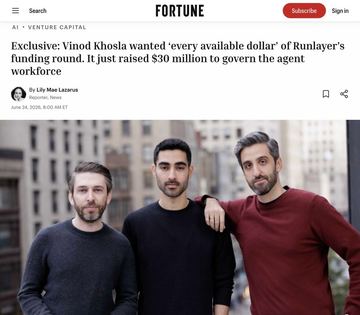
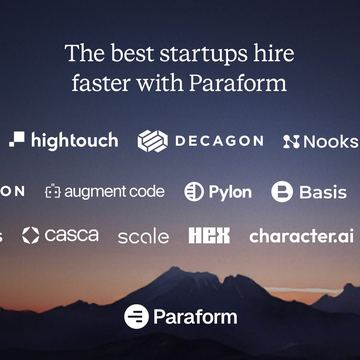
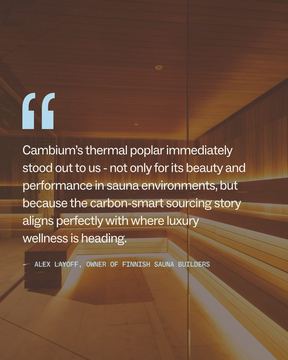
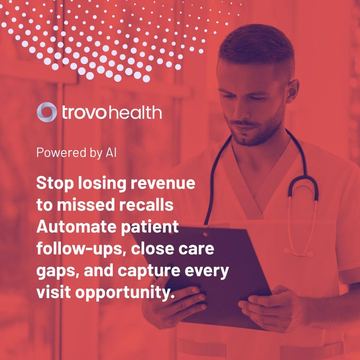
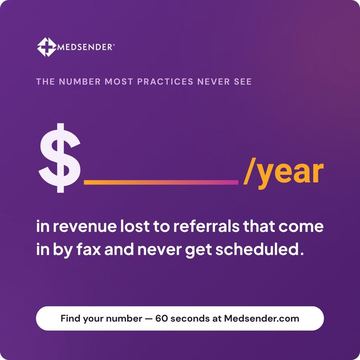
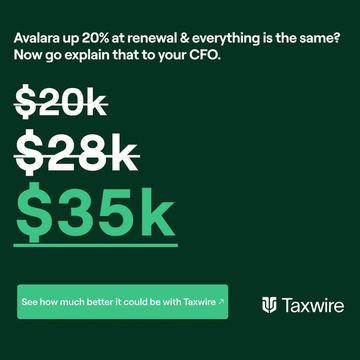
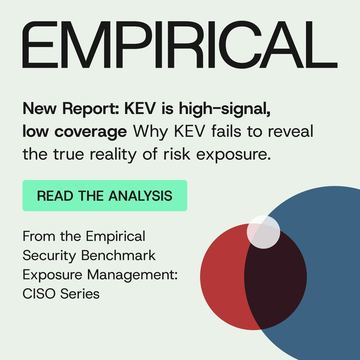
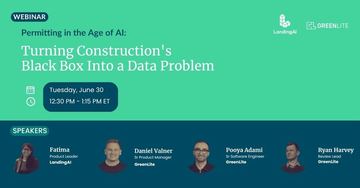
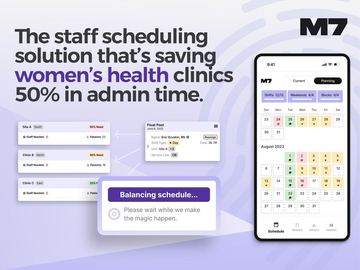
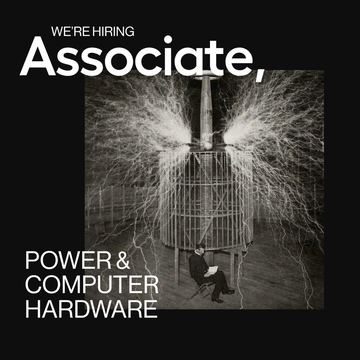
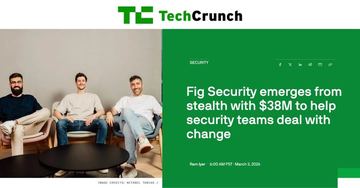
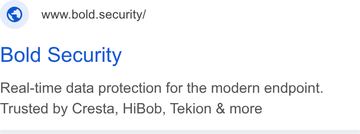
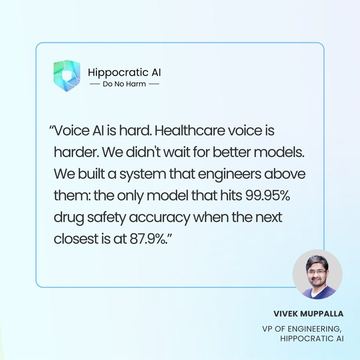
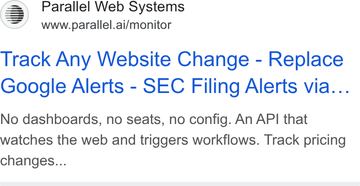
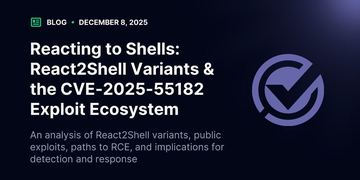
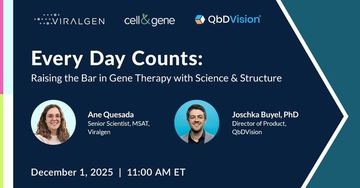
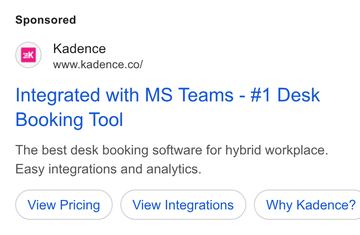
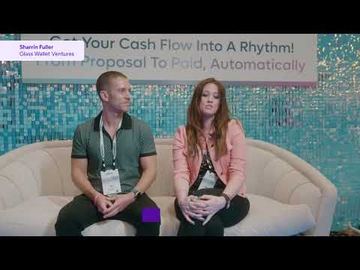
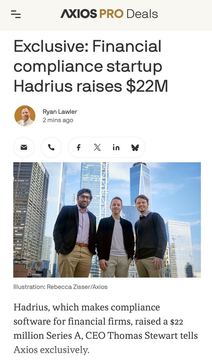
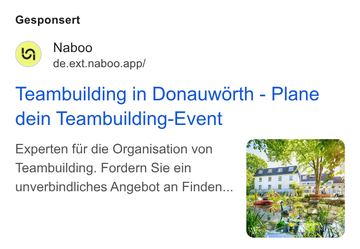
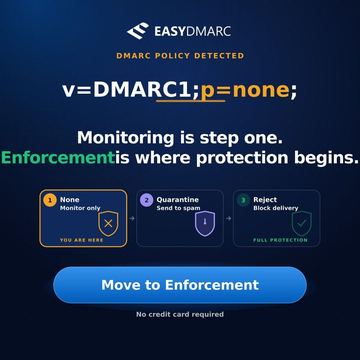
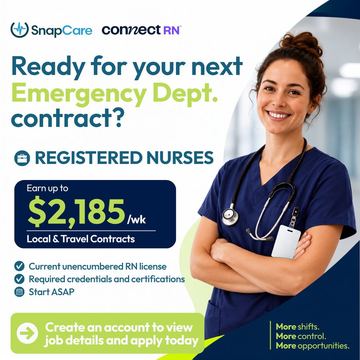
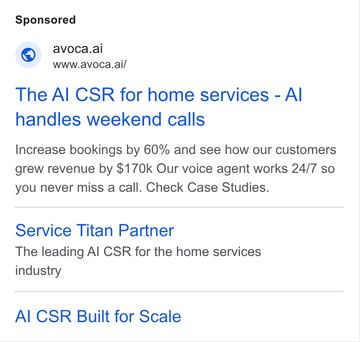
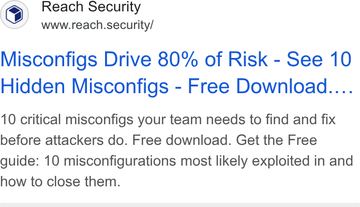
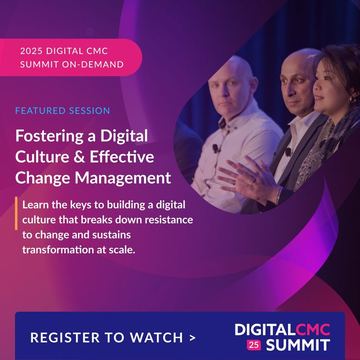
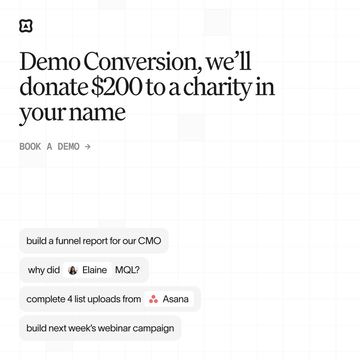
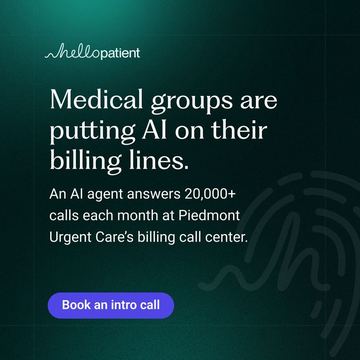
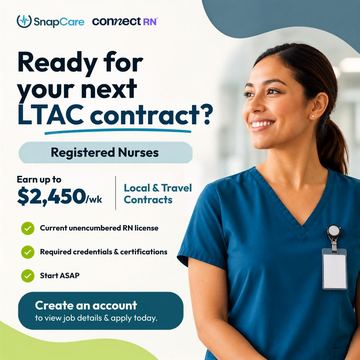
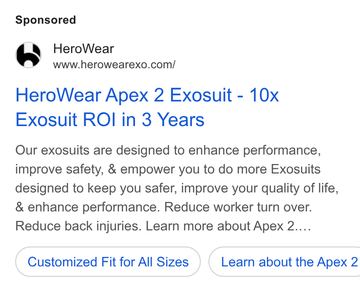
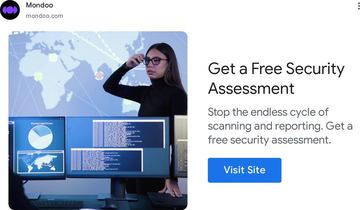
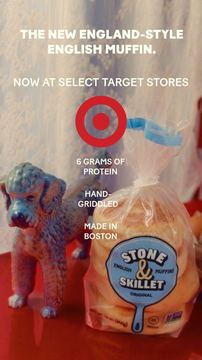
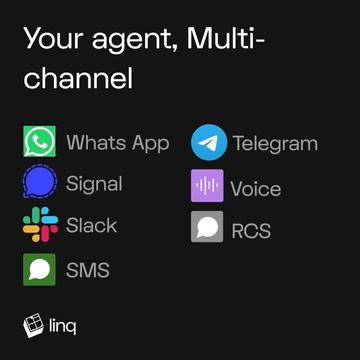
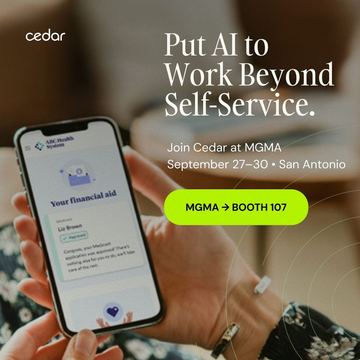
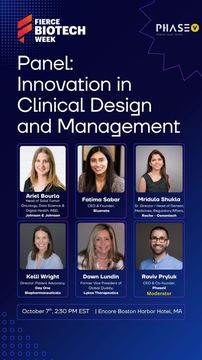
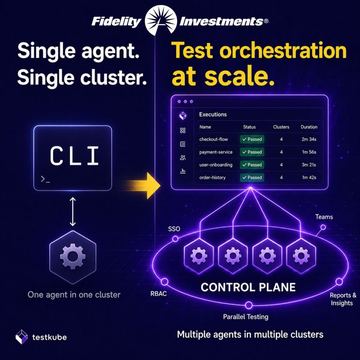
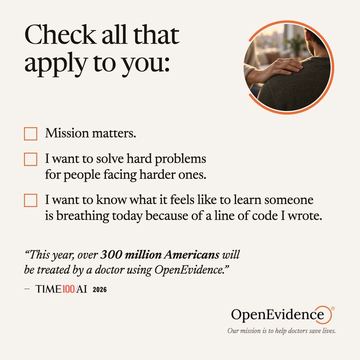
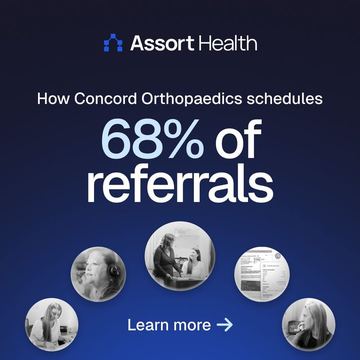
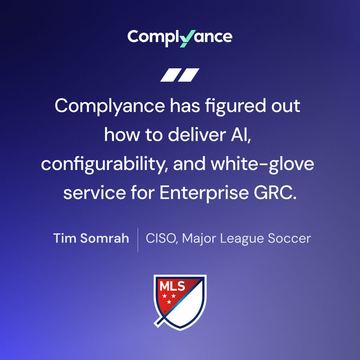
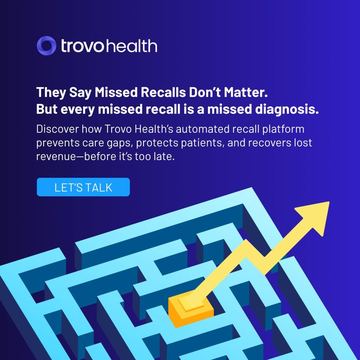
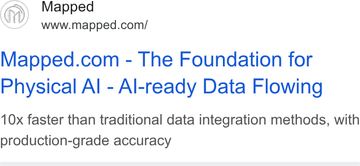
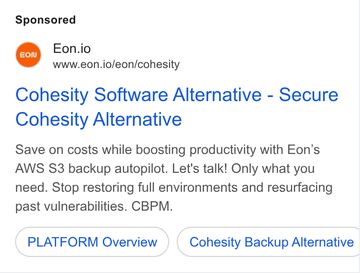
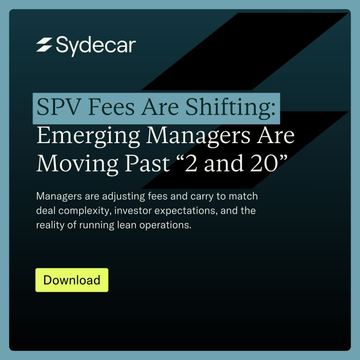
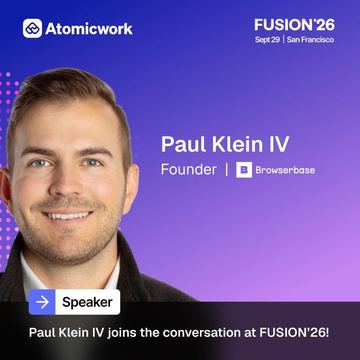
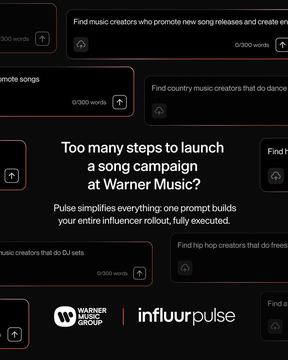
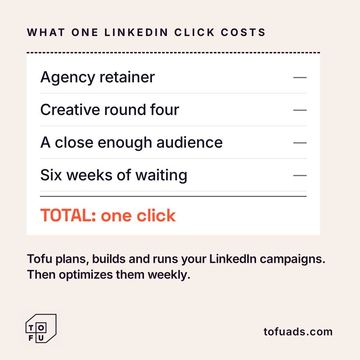
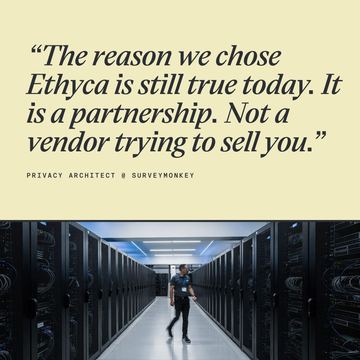
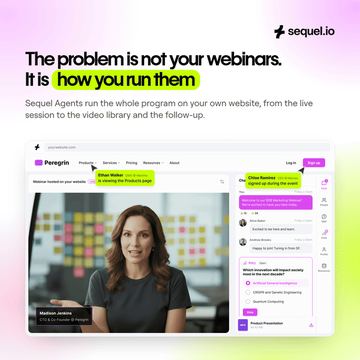
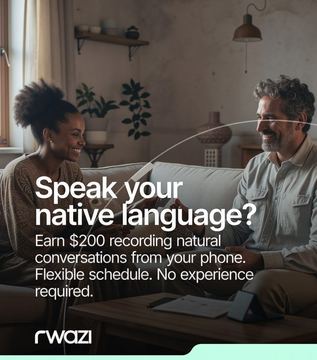
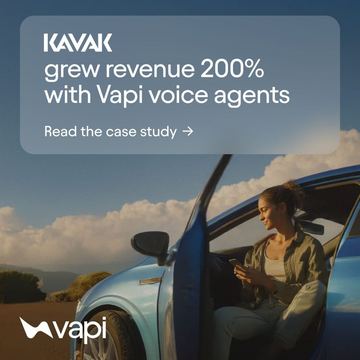
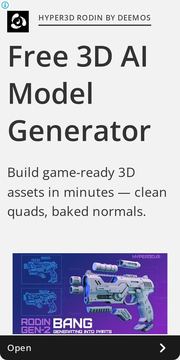
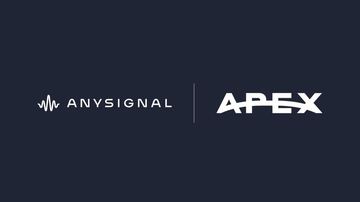
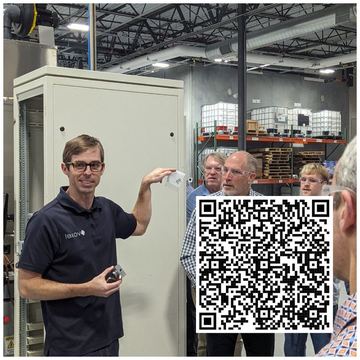
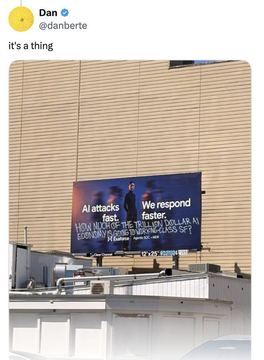
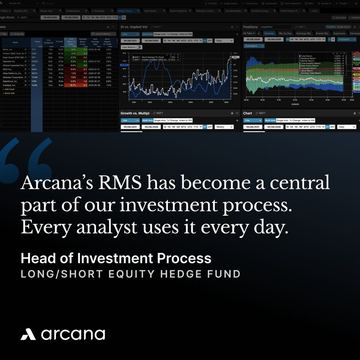
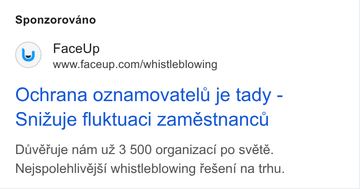
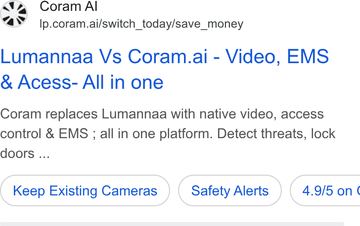
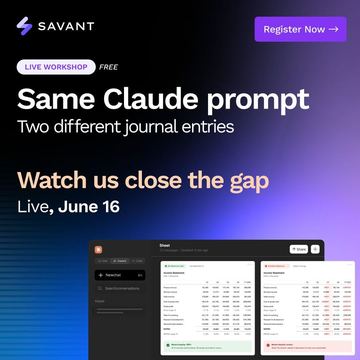
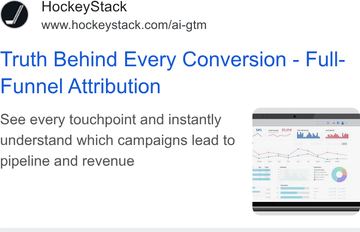
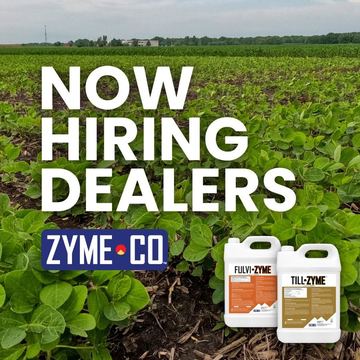
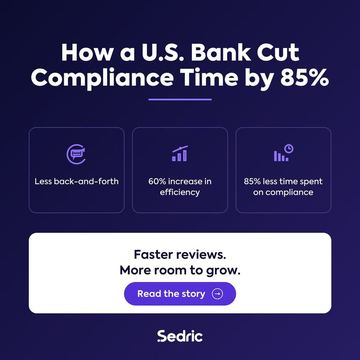
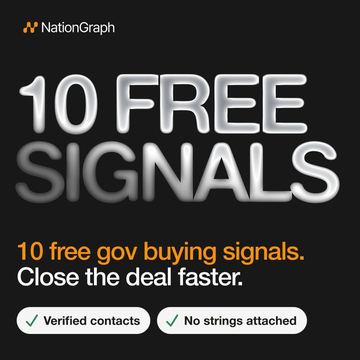
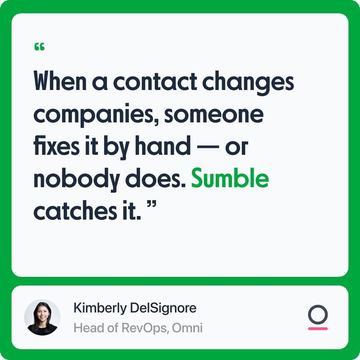
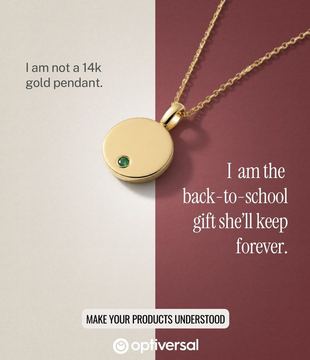
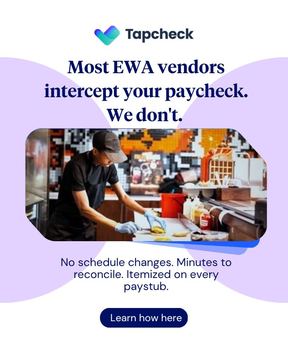
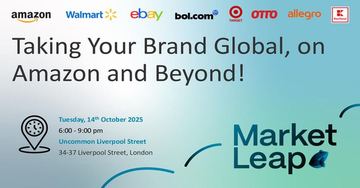
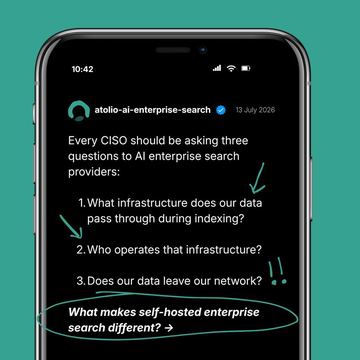
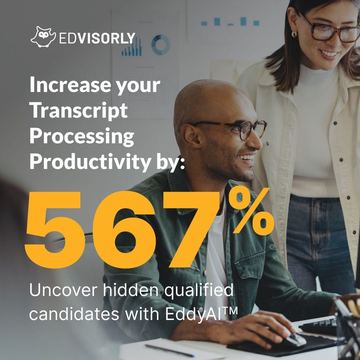
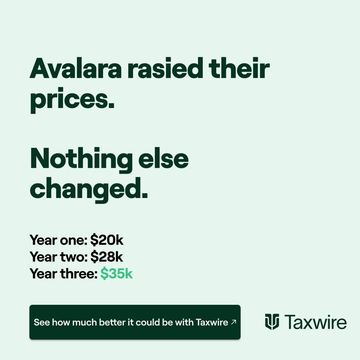
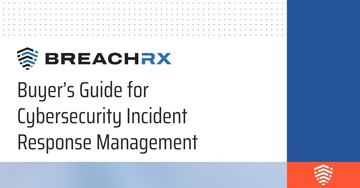
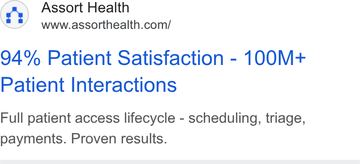
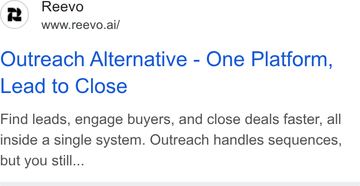
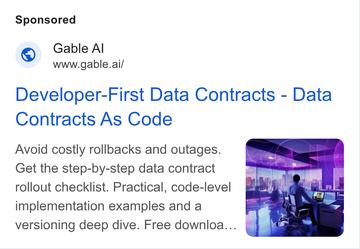
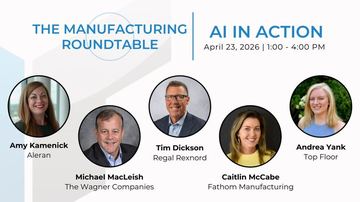
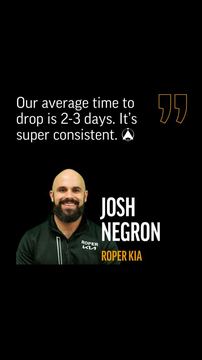
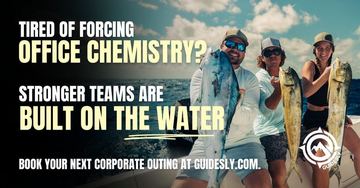
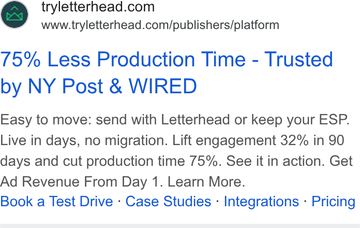
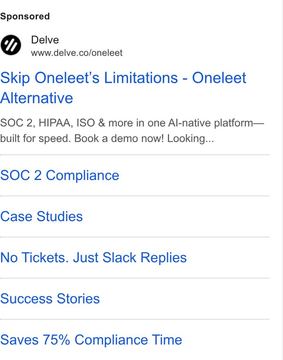
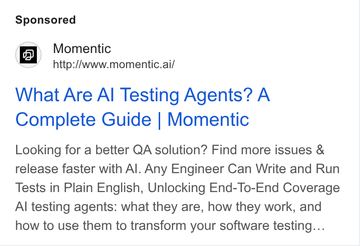
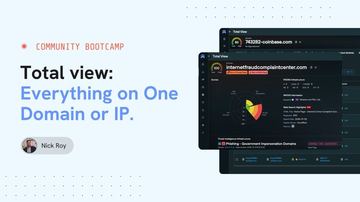
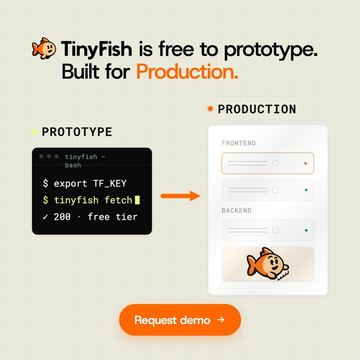
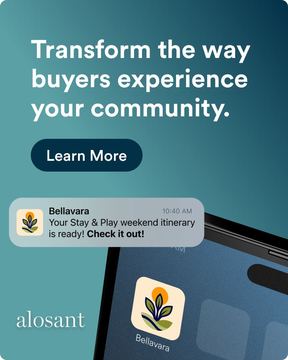
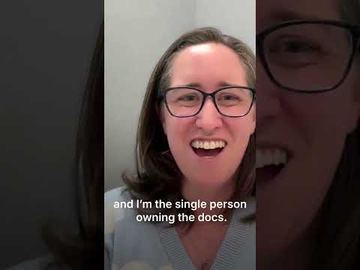
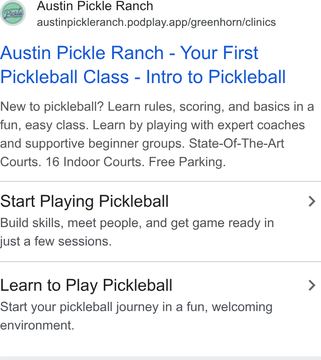
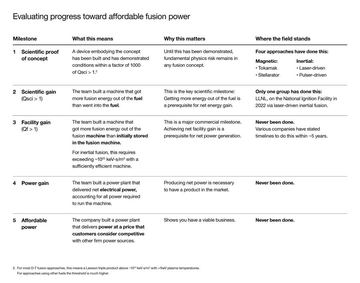
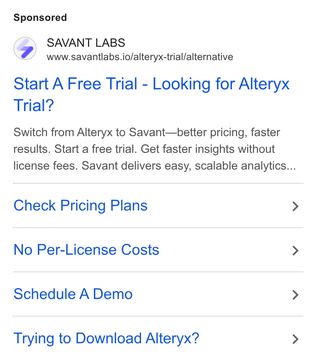
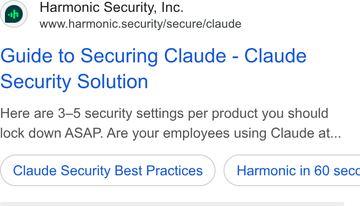
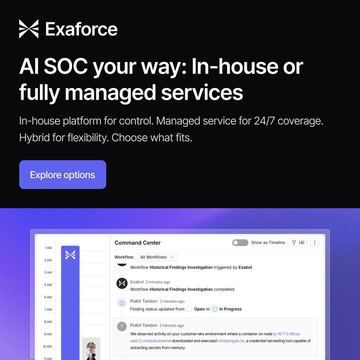
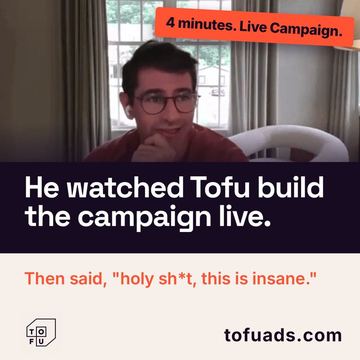
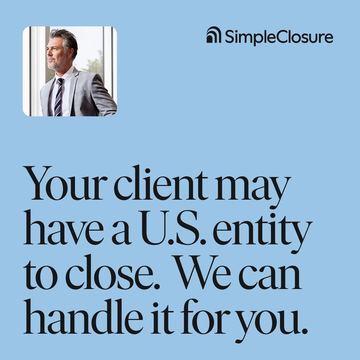
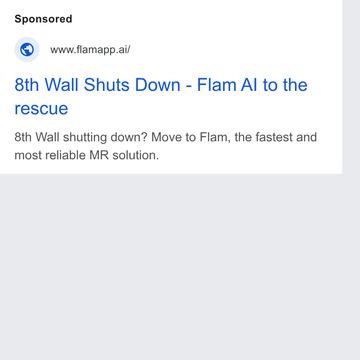
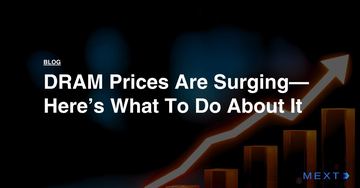
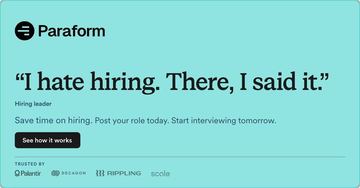
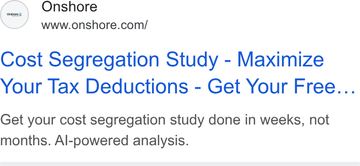
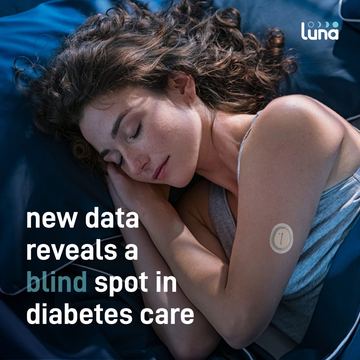
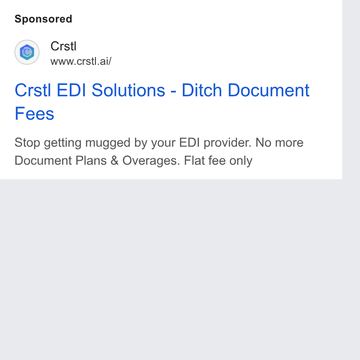
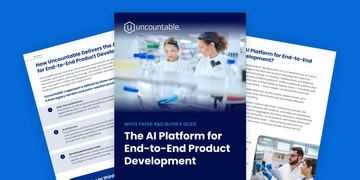
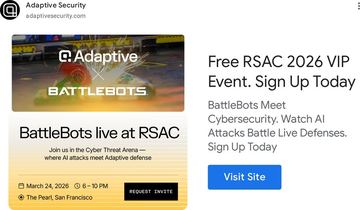
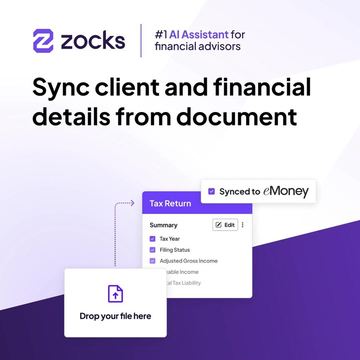
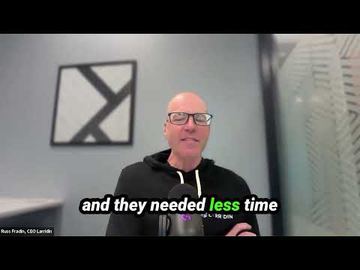
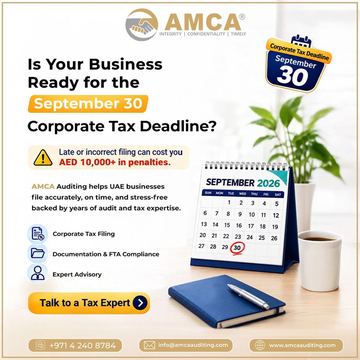
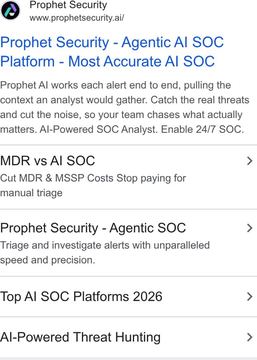
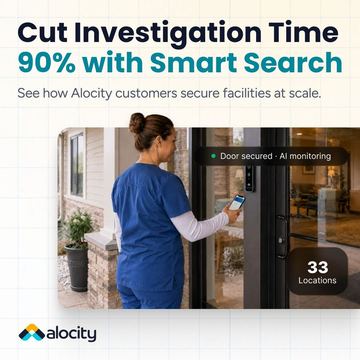
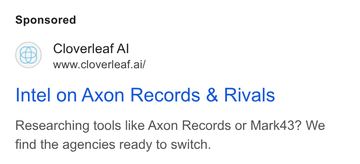
Ads as served in the public libraries, credited to the advertiser.
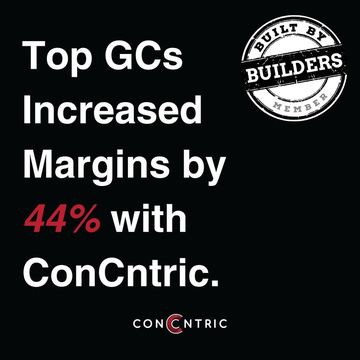
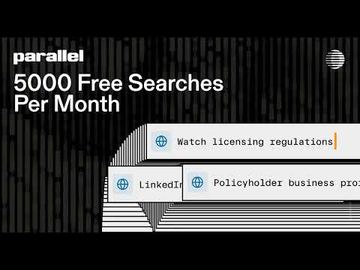
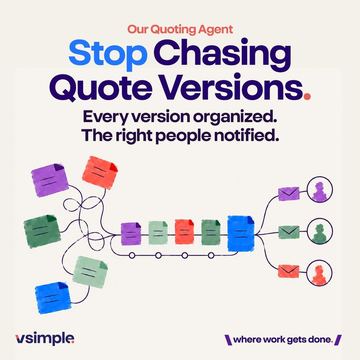
268 B2B ads, by type




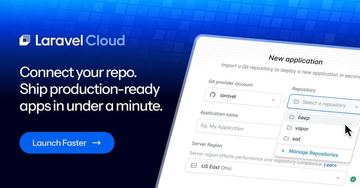
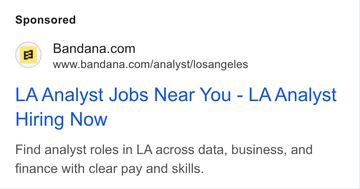
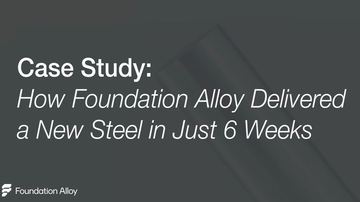
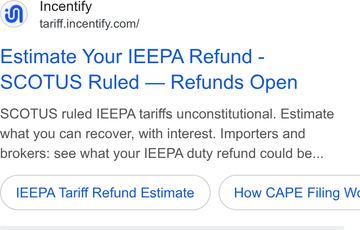



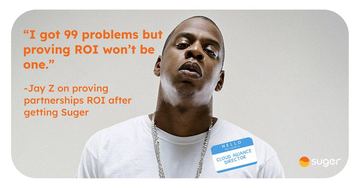

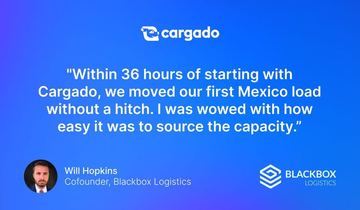

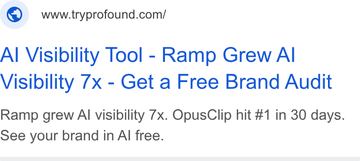
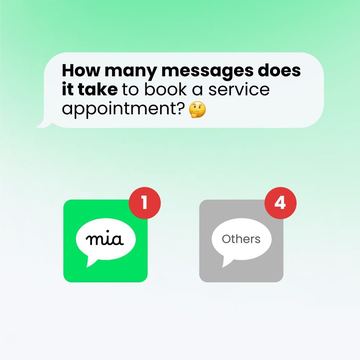



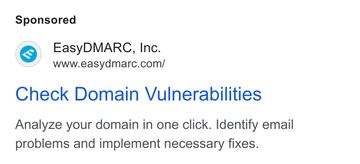
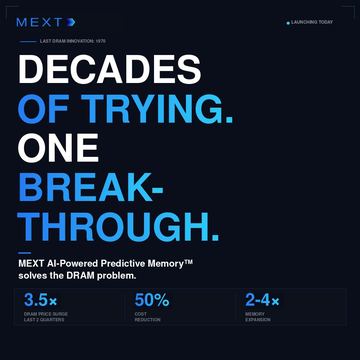
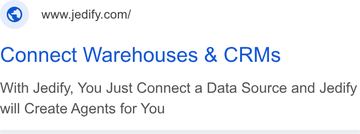
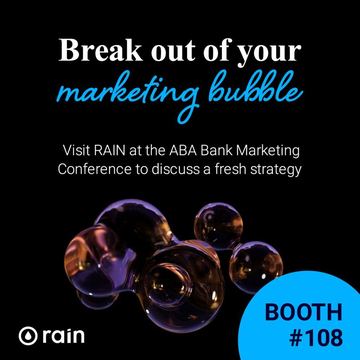



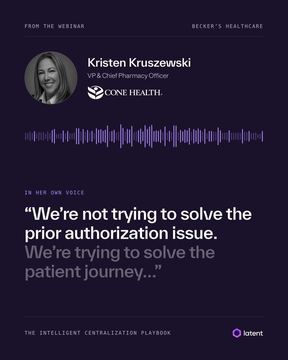
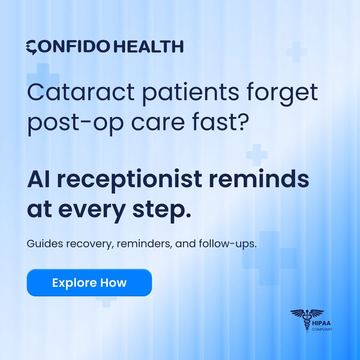
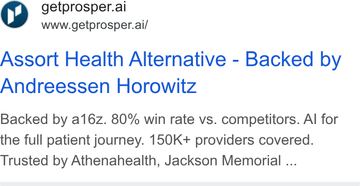
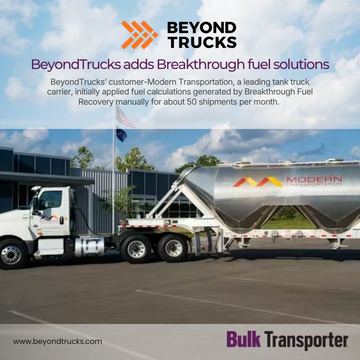
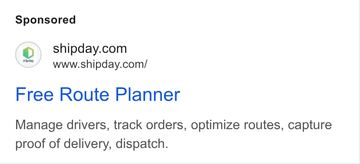
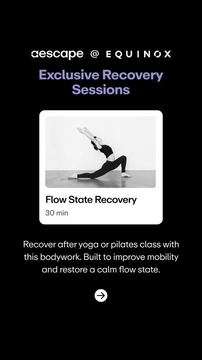
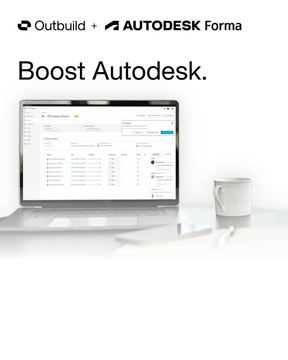




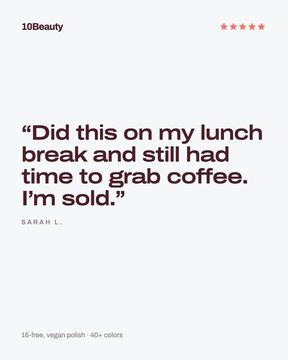

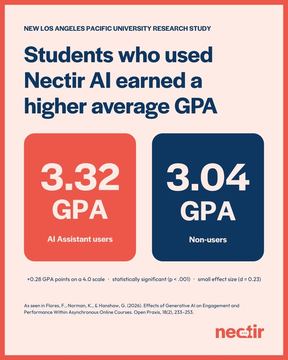

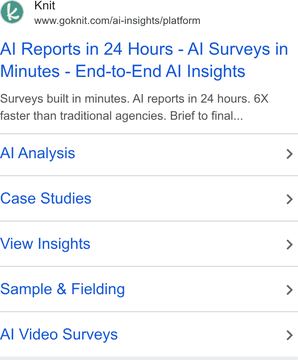
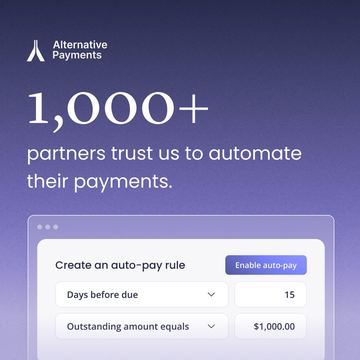
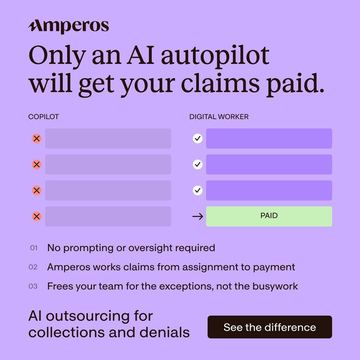

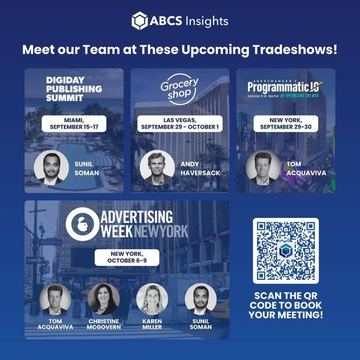




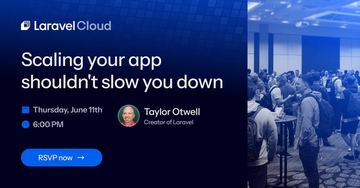
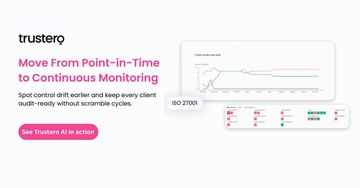
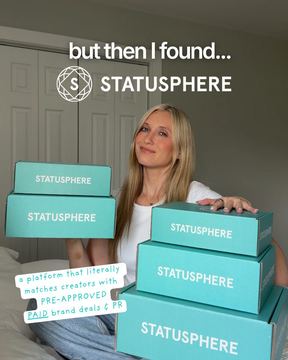
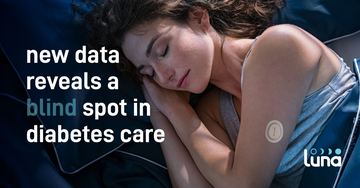
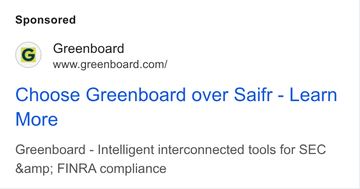
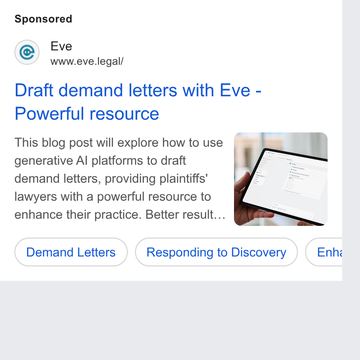

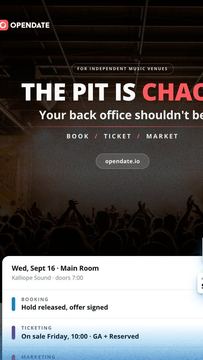

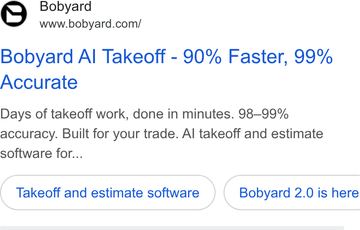
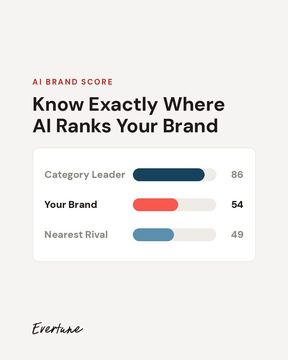
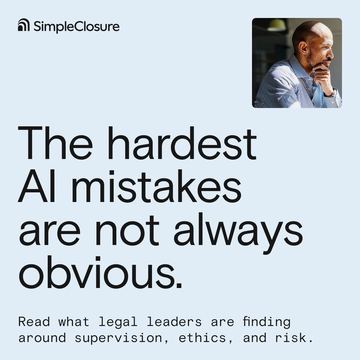
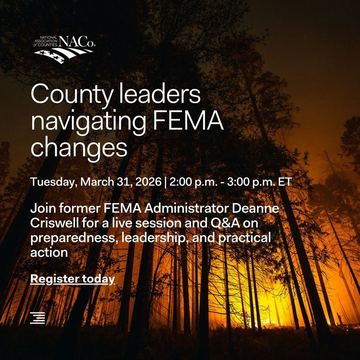
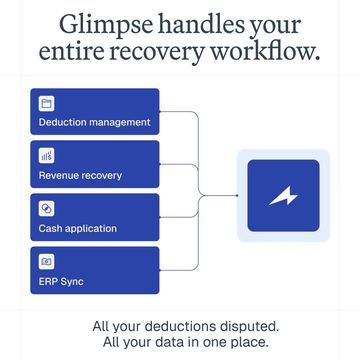
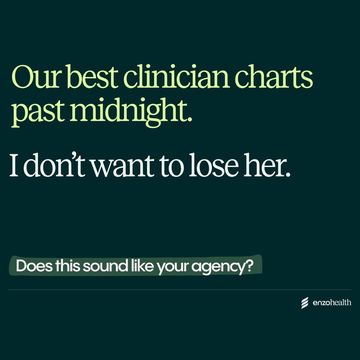
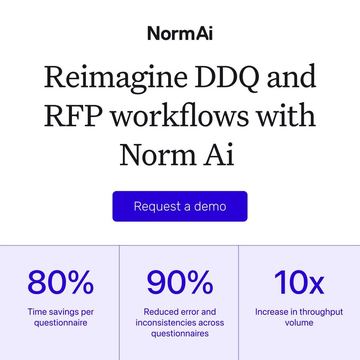



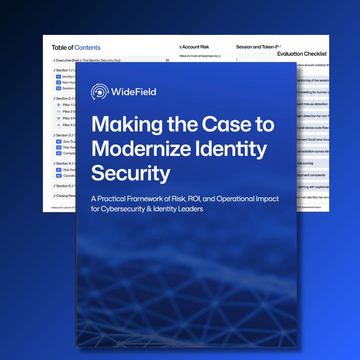
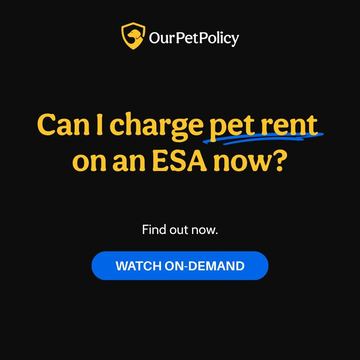
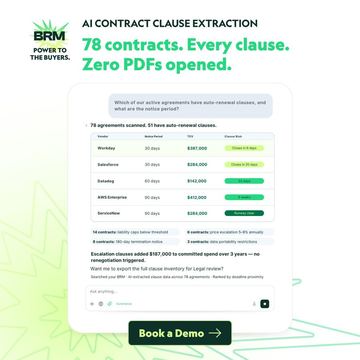
The copy is short, says AI, and almost never names a customer
30,518 of the ads carry readable text. The median headline is 6 words (7 on LinkedIn, 6 on Google, 5 on Meta). 46.7% say "you" or "your", 44.8% contain a number, 11.4% ask a question.
41% of the copy mentions AI, which is four times the rate across all Series A companies worldwide. In this cohort, at this moment, saying AI is the norm rather than a differentiator.
What the words promise: 11.3% say "free", 9.5% offer a report or guide, 6.6% a demo, 5% mention price, 3.2% name an integration.
Proof is where the gap is widest. 2.3% of ads name a customer, 2.2% carry a hard number like a percentage saved, 2% mention a security standard such as SOC 2, and 0.2% mention a review rating. Fewer than one ad in forty names a customer. Almost every one of these ads asks a stranger to take a claim on trust.
Most clicks go to a lead form or a homepage
Now the click. We can see a destination for 446 of these advertisers, and we could identify where it goes for 363 of them, across 886 pages. (303 destinations sit behind a shortened link that we could not follow, so they are left out rather than guessed at. Google's library shows only the domain, so this section is what LinkedIn and Meta expose.)
Taking each advertiser's most-used destination, 33.9% send the click to another page on their own site and 22.6% send it to the homepage. 28.1% never send it anywhere: they use a LinkedIn lead form, which collects the details inside LinkedIn and never loads a page of theirs at all.
The lead form is a real choice with real trade-offs. It converts better than a page because nothing has to load and the fields are pre-filled, and it needs no engineering. It also means no analytics of your own, no retargeting pixel firing, no chance to explain anything beyond the ad, and a lead who has never seen your product. Roughly a quarter of this cohort has made that trade for their main channel.
Only 5.2% point at a demo or contact page and 0.8% at a signup or trial page, which lines up with the offers section: most of these ads are not asking for a meeting.
Counted per ad rather than per company, the homepage grows to 36.8%, because the companies running the most ads are the most likely to point all of them at the same place.
How the landing pages are built, and what is on them
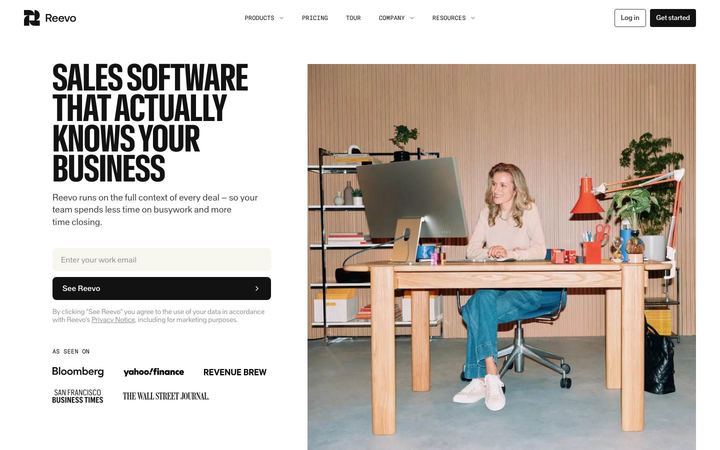
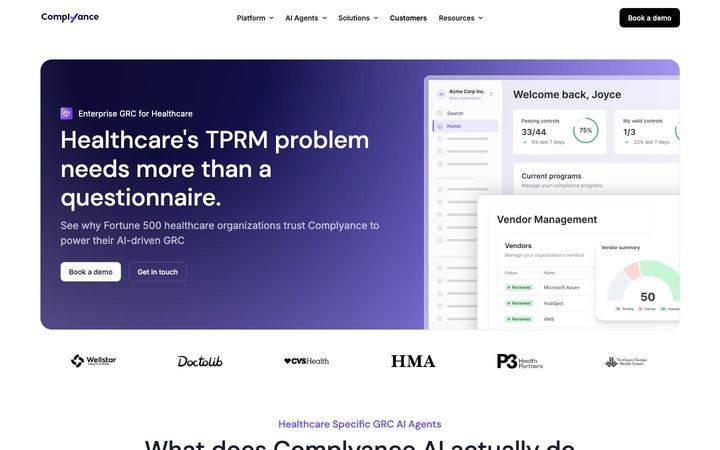
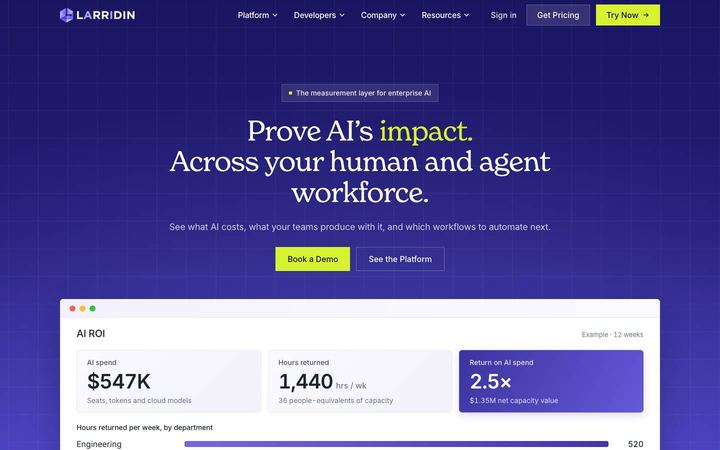
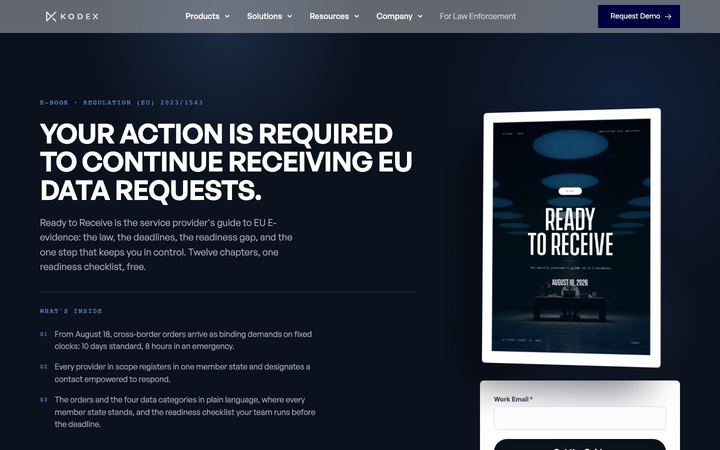
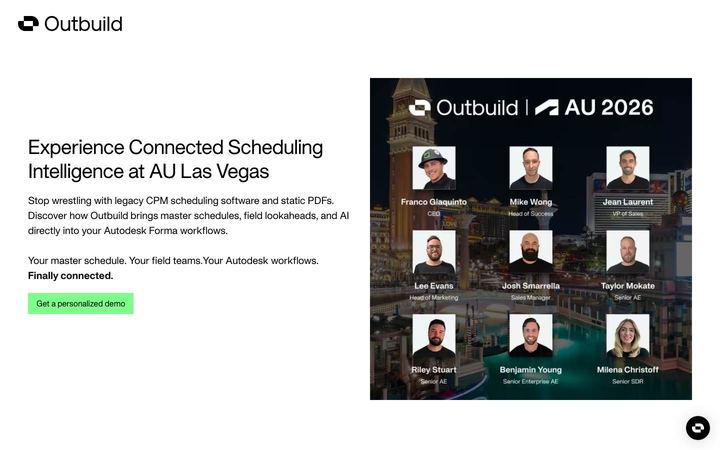
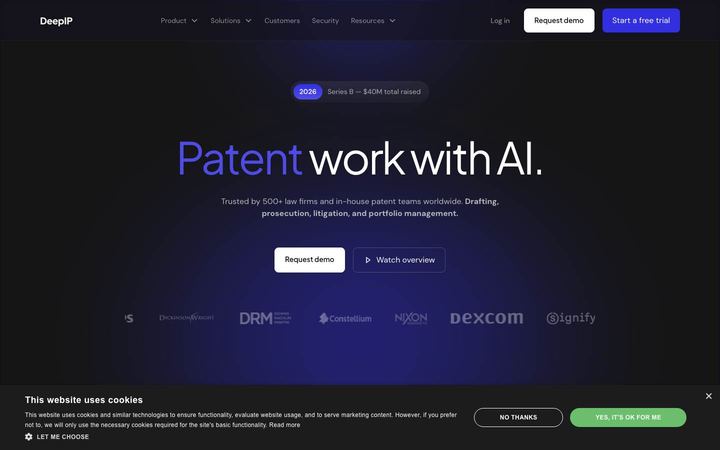
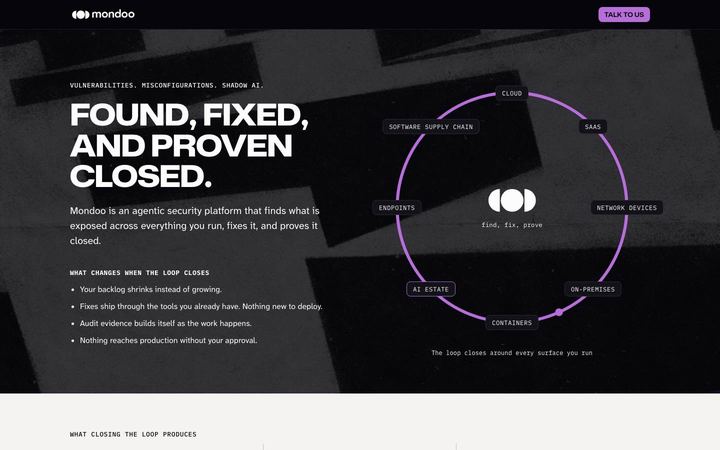
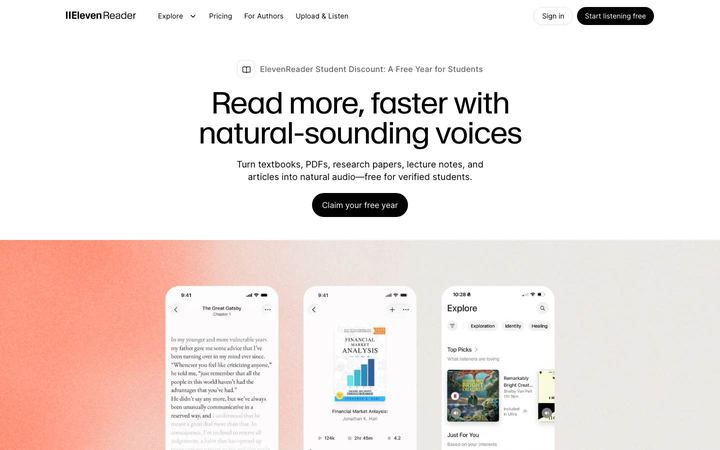
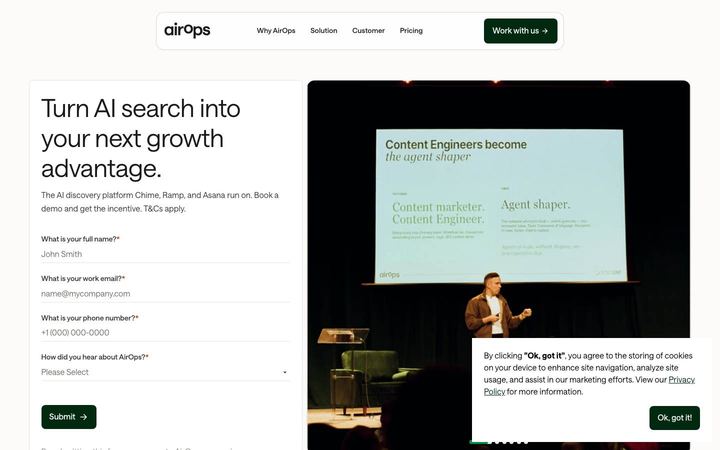
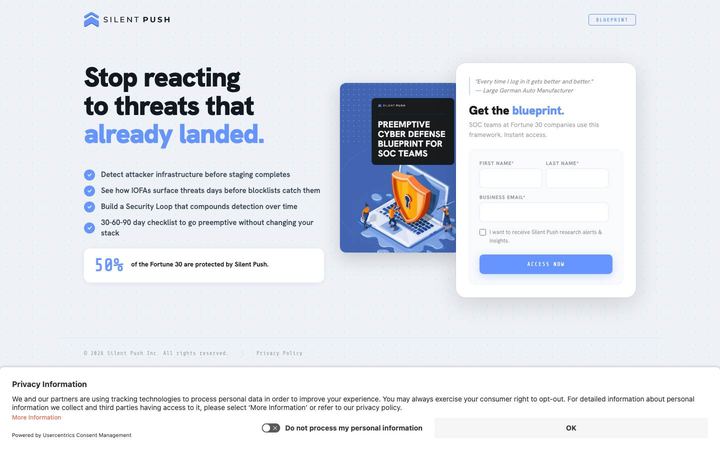
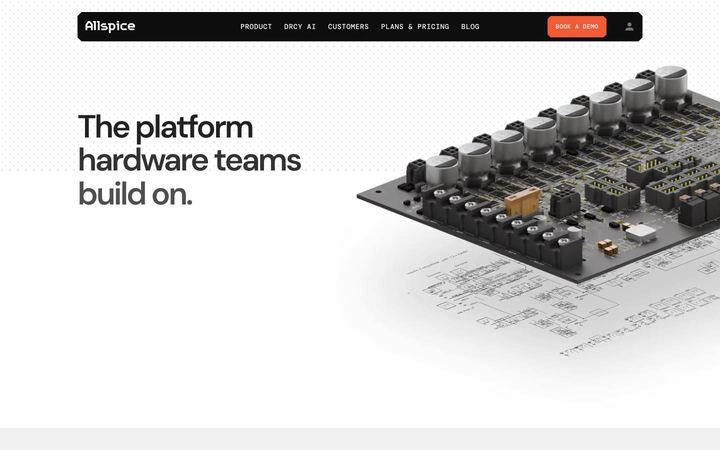
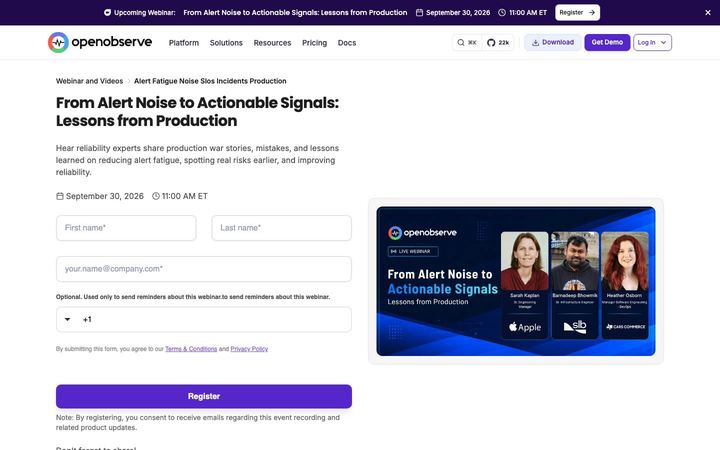
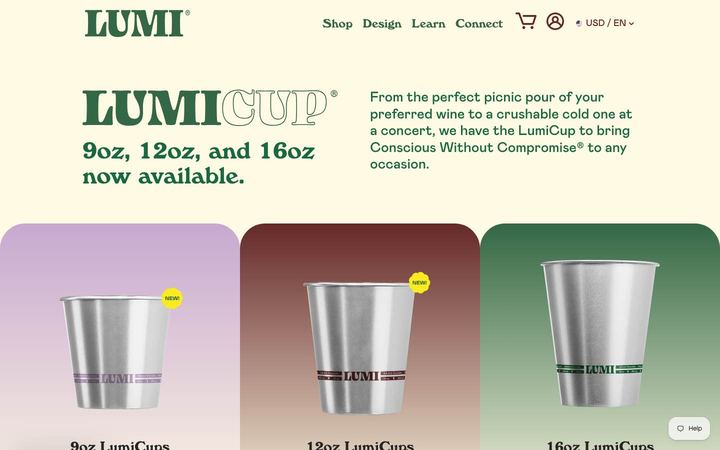
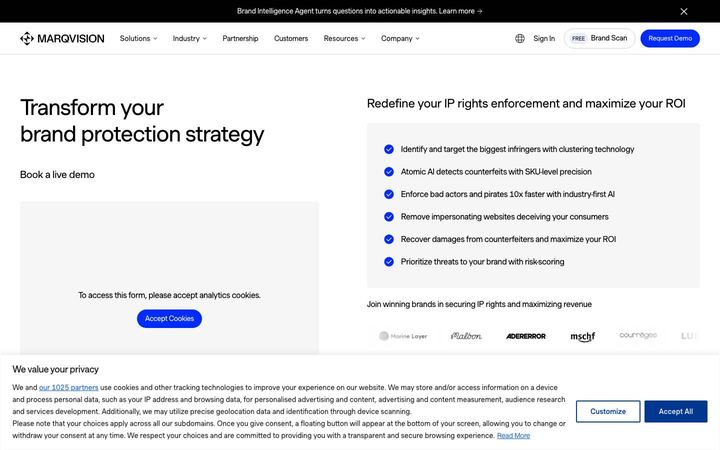
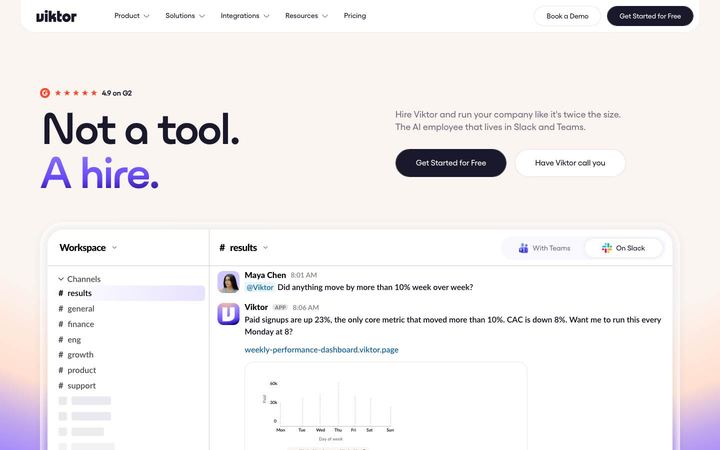
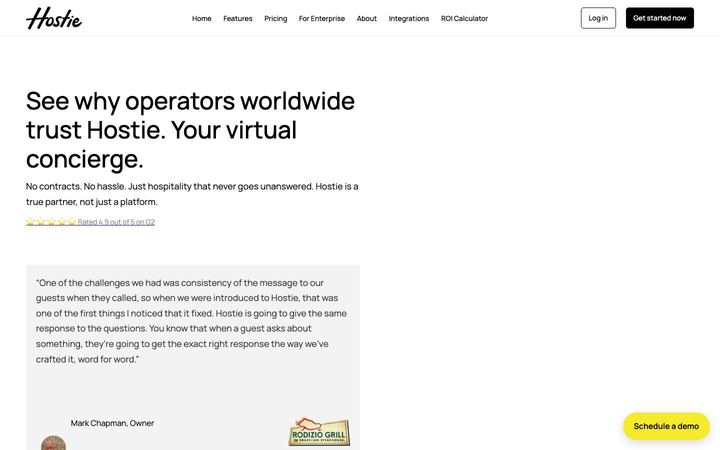
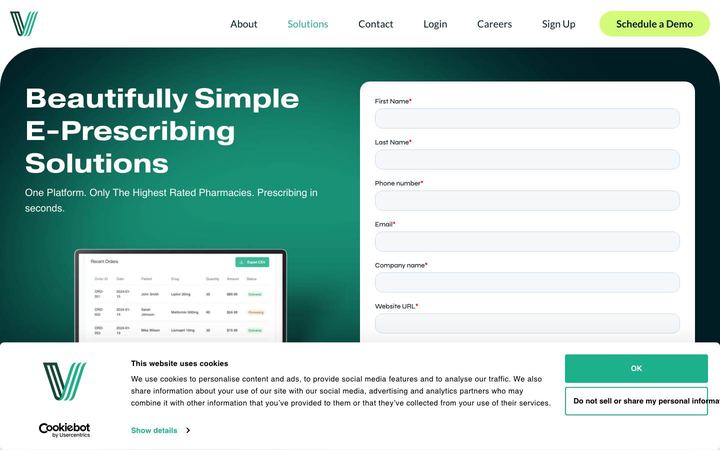
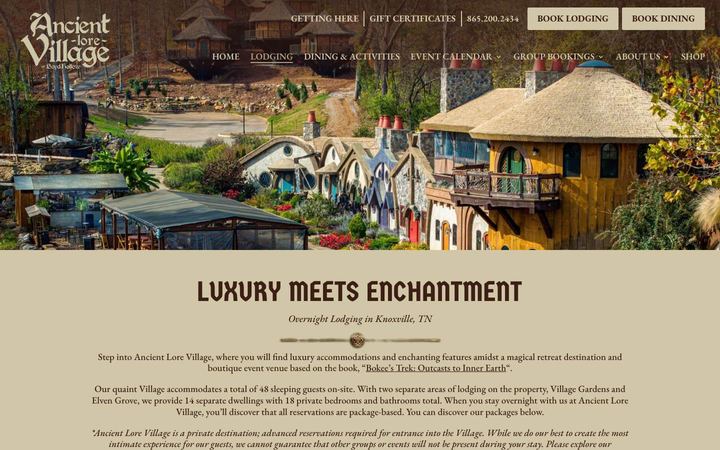
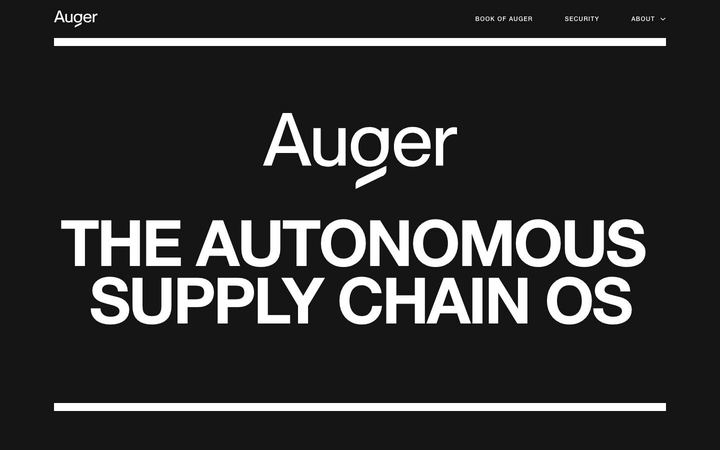
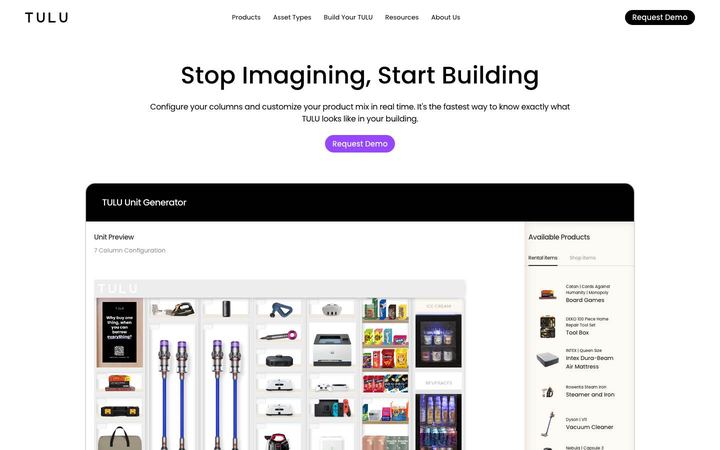
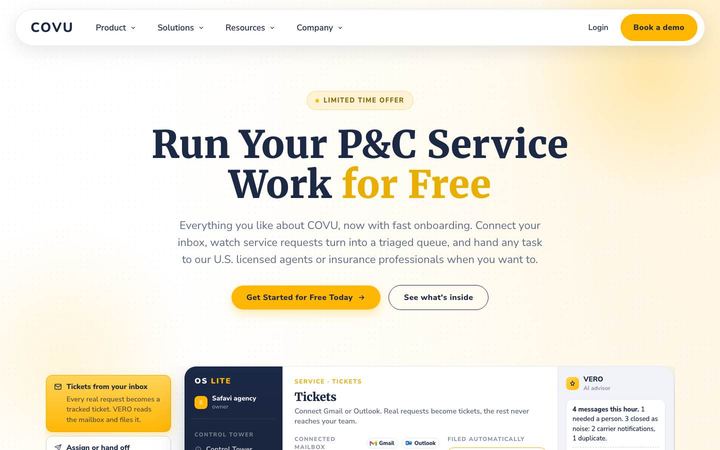
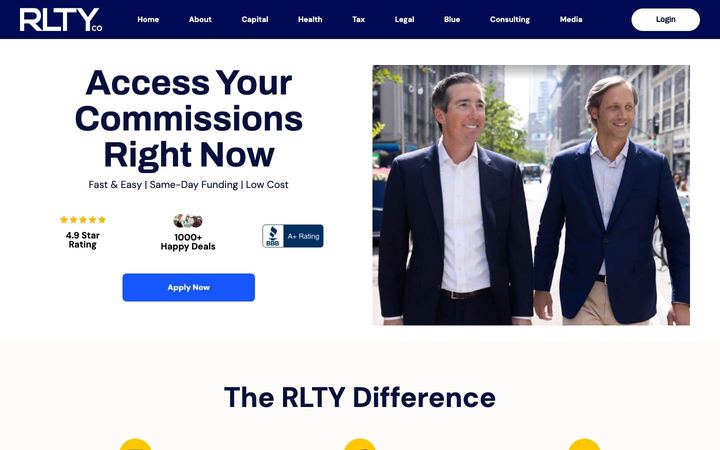
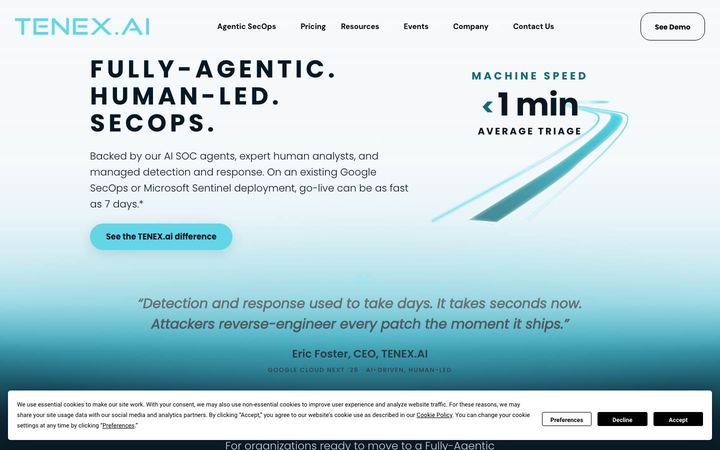
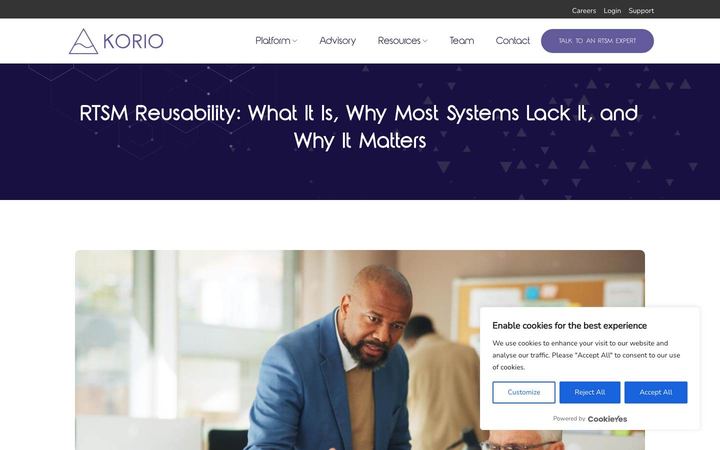
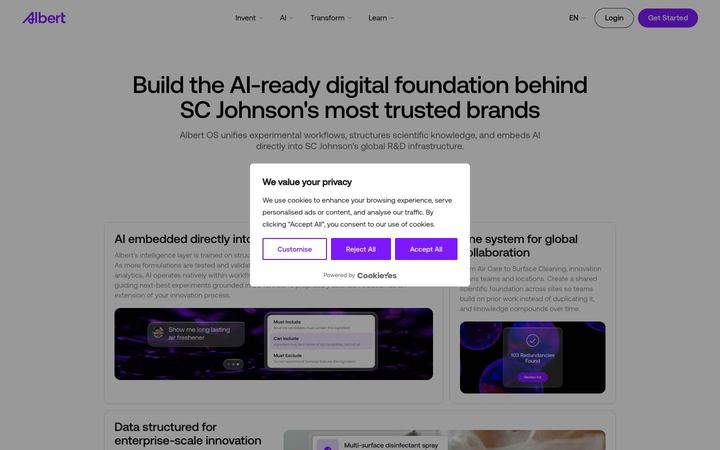
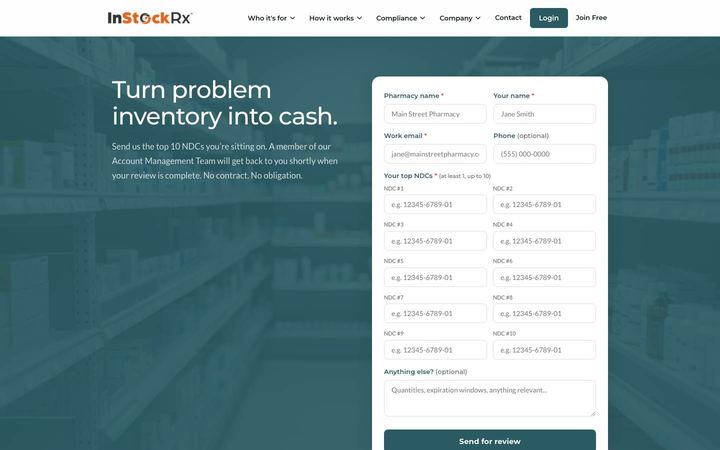
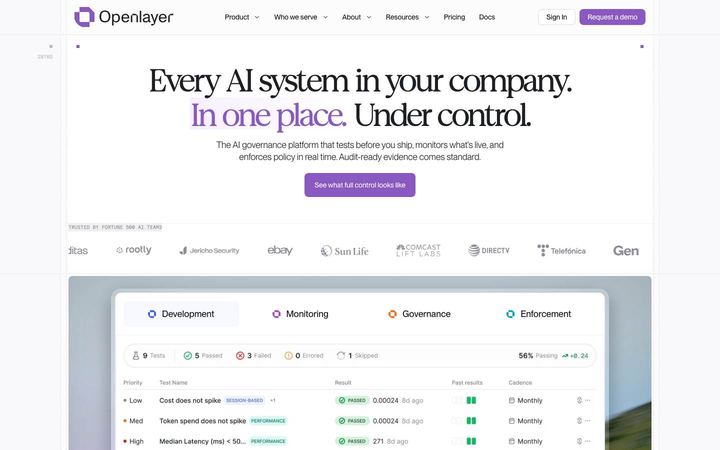
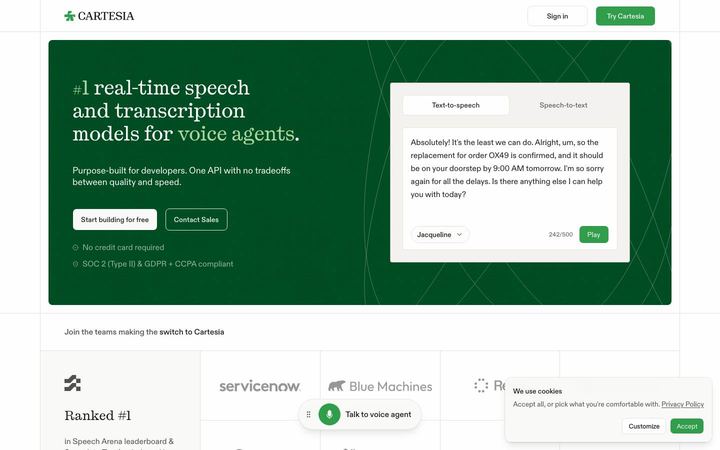
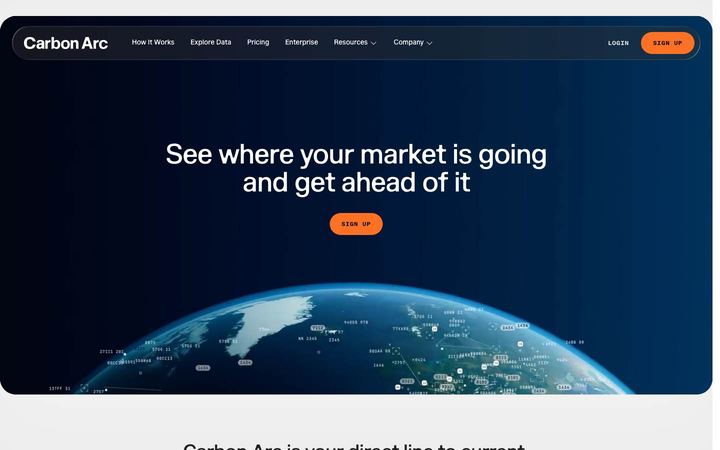
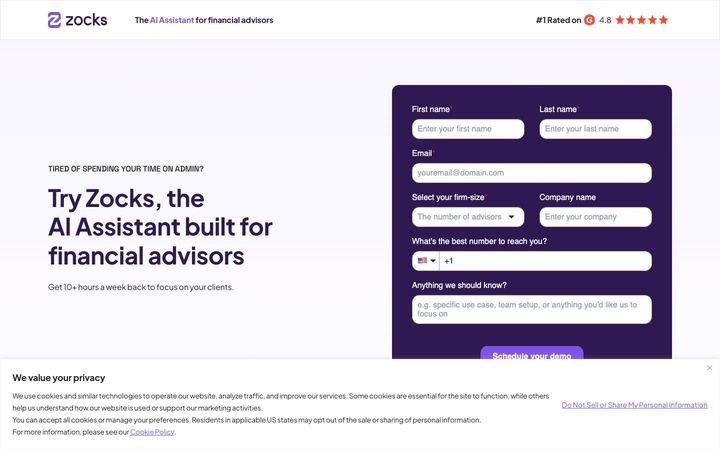
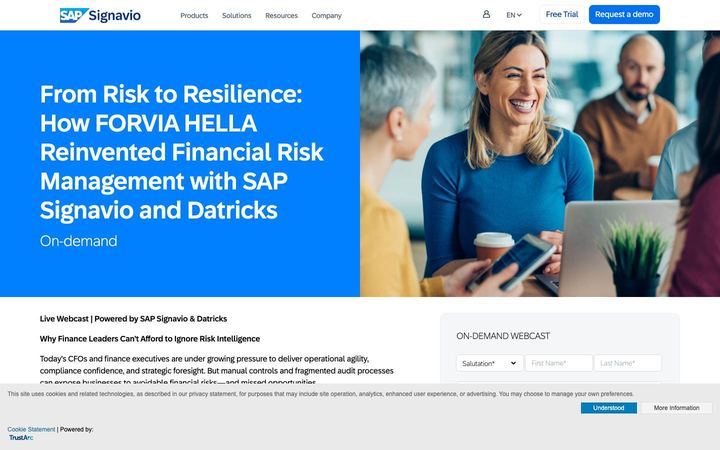
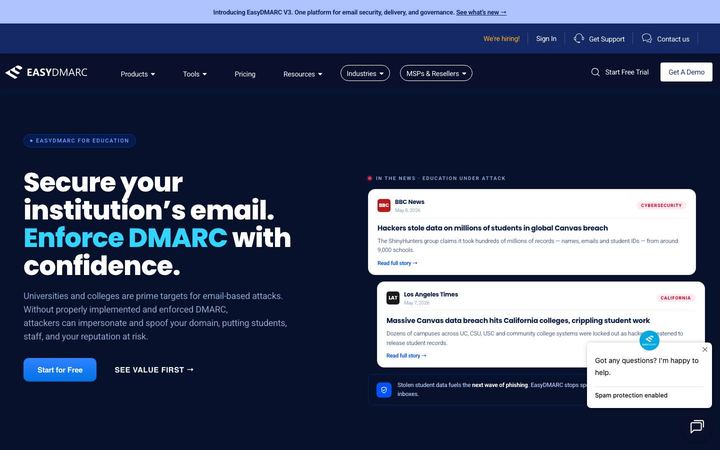
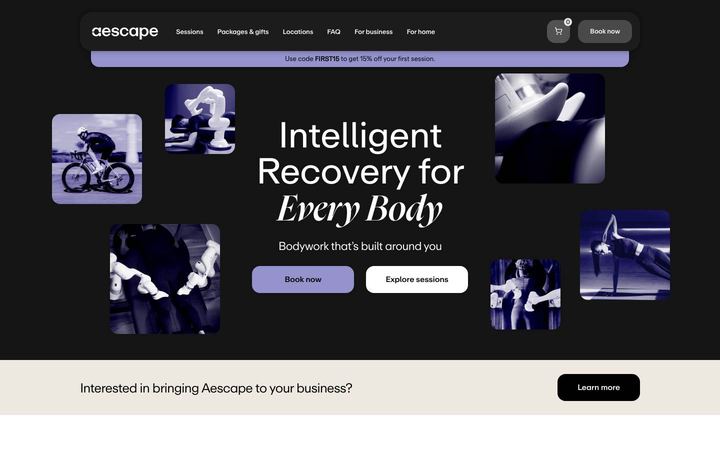
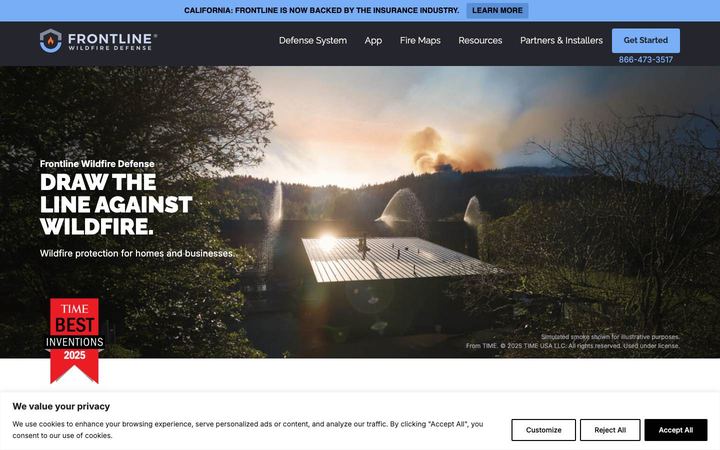
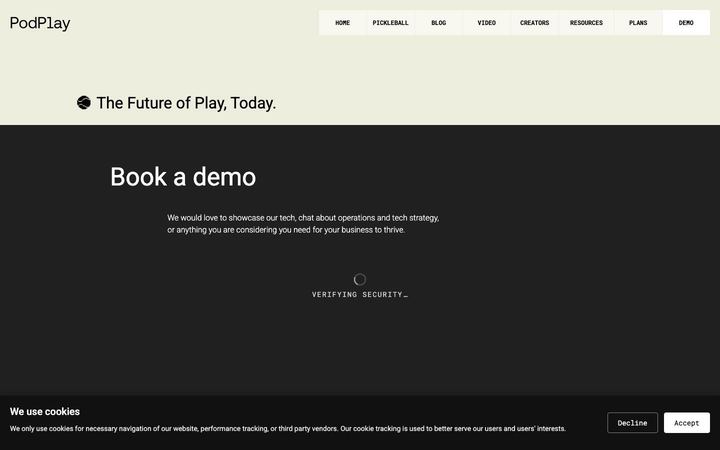
We rendered 119 of the pages these ads point at, from 90 companies, and read what is on them. Desktop and mobile, as they looked on the capture date.
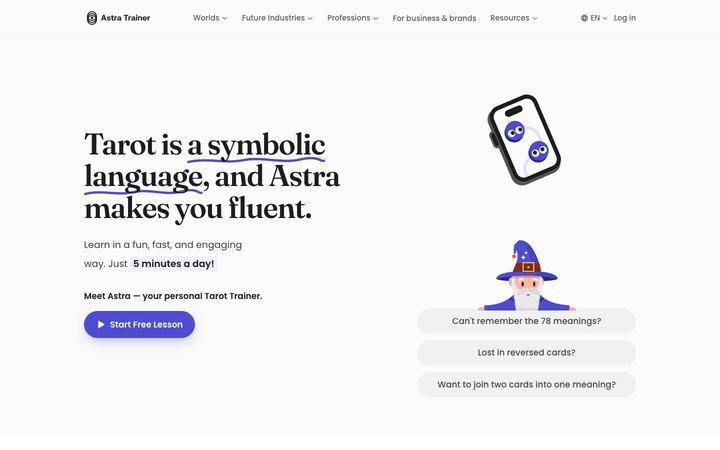
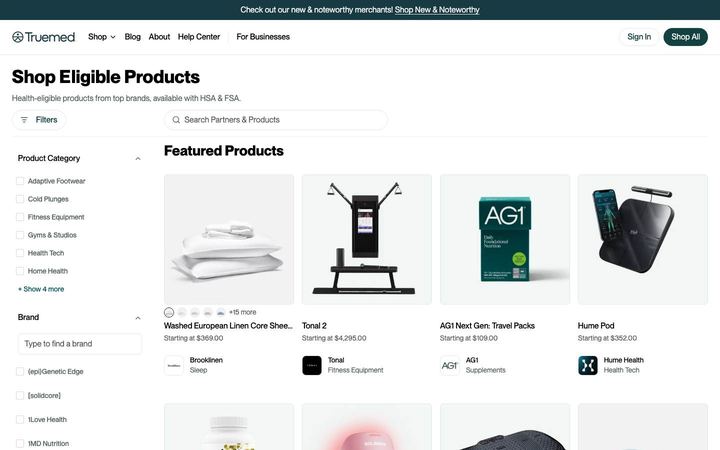
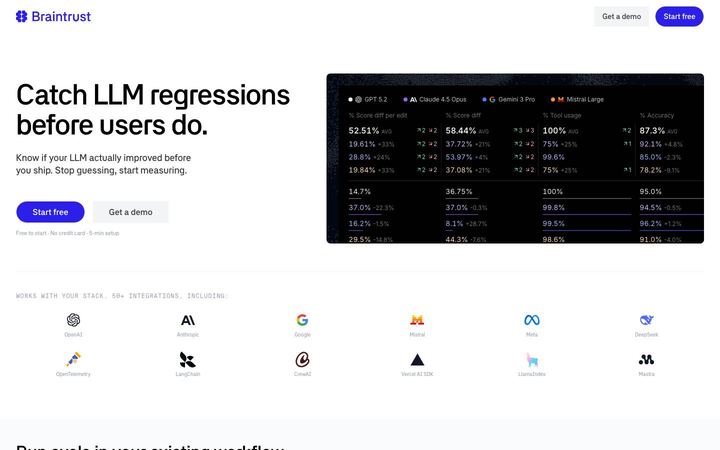
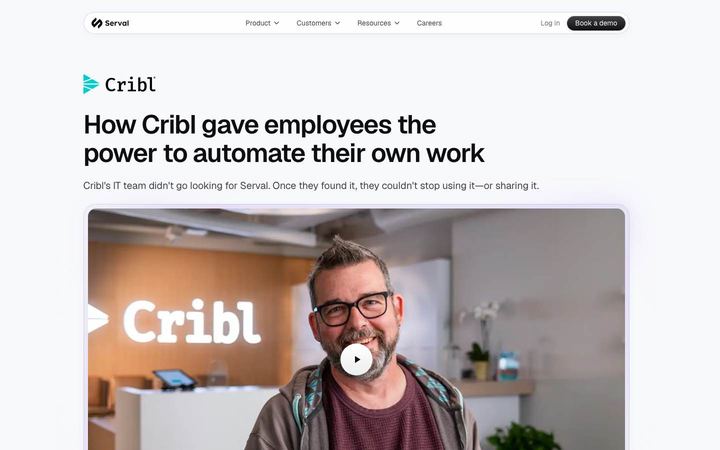
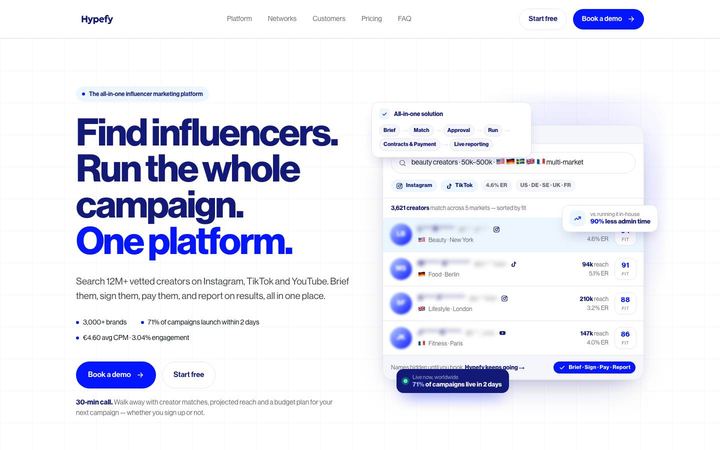
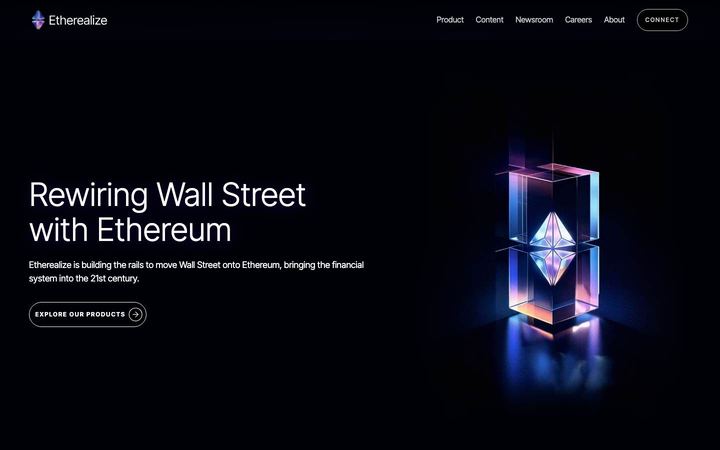
What are they built with? HubSpot 36.1%, Unbounce 29.4%, Next.js 13.4%, custom / unknown 9.2%. 73.9% of the pages are built on a page builder or a CMS rather than in the product's own codebase. That matters more than it sounds: a page on Webflow or Unbounce can be changed by a marketer this afternoon, while a page inside the app repository needs an engineer and a deploy.
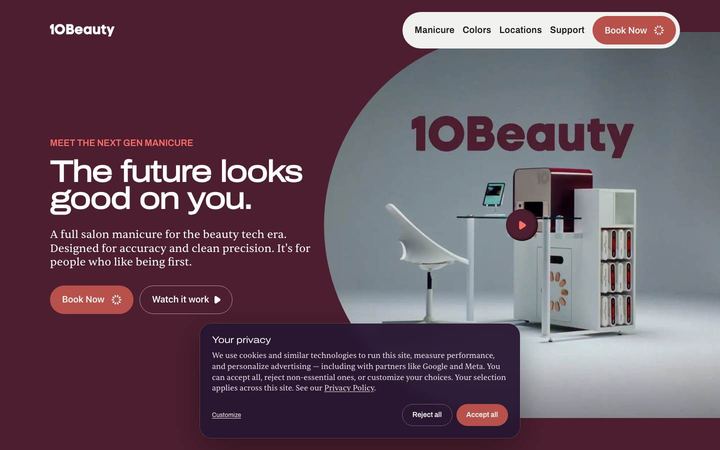
39.5% of the pages are built for the campaign rather than being an existing page that already lived on the site. The rest are the homepage, a product page or a blog post doing double duty.
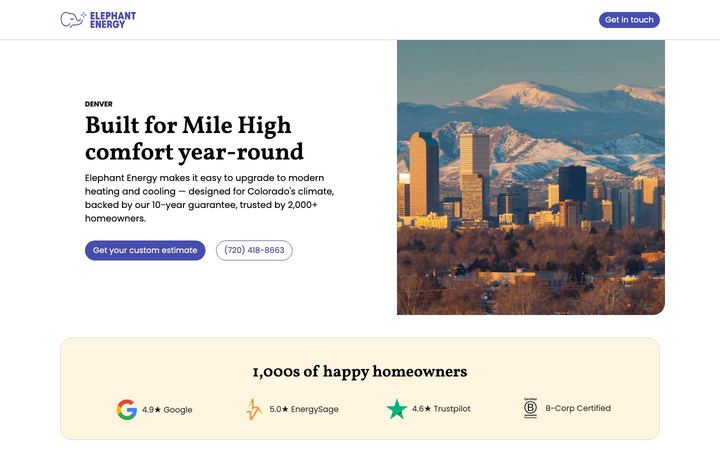
What is actually on them: 77.3% have a single clear headline, 95.8% put a call to action above the fold, 26.1% trim the navigation to five links or fewer, 37.8% have a form at all and 20.2% put it above the fold. 47.9% show customer logos, 35.3% have a video, 42% show pricing. The median page carries 12 calls to action and 4 navigation links.
Scored against five basics that every landing page guide agrees on (one headline, a call to action above the fold, trimmed navigation, proof above the fold, a form short enough to fill), the median page gets 4 of 5. The item most often missed is proof: 52.1% put any customer evidence where you can see it without scrolling.
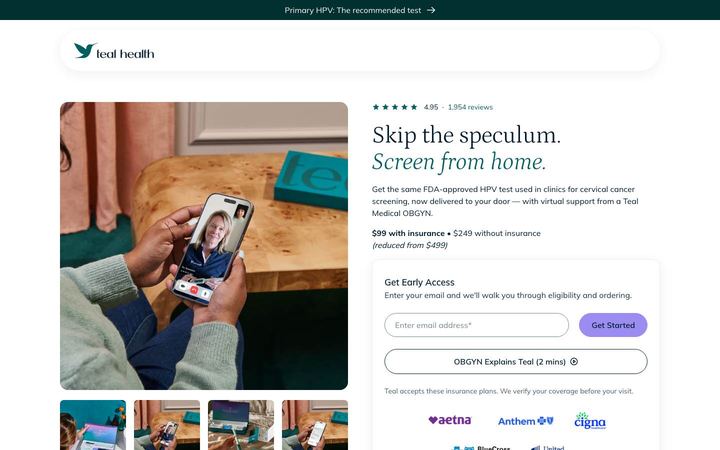
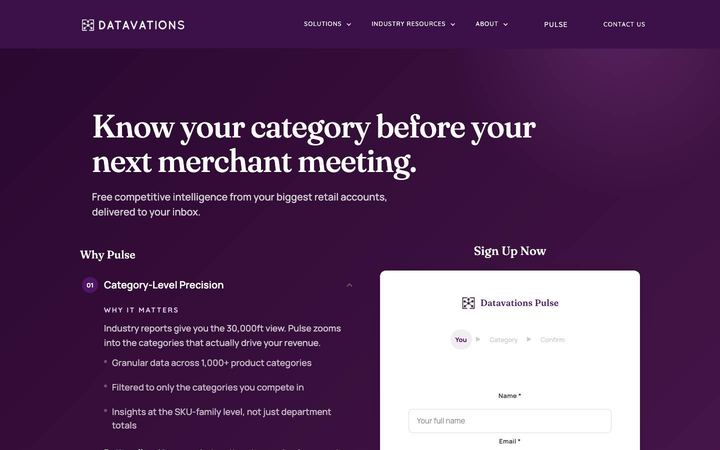
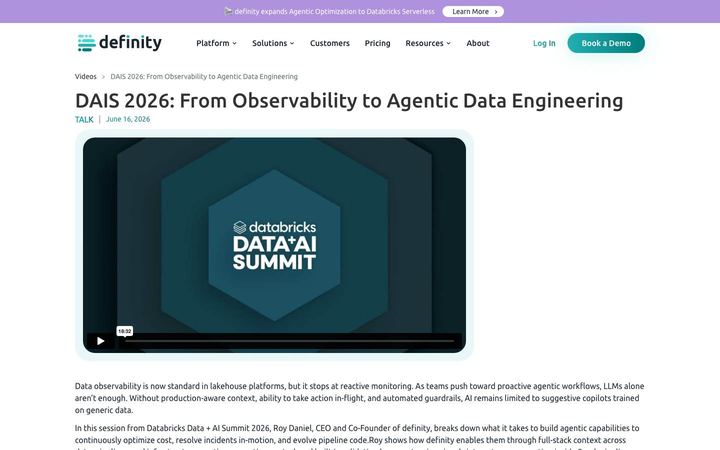
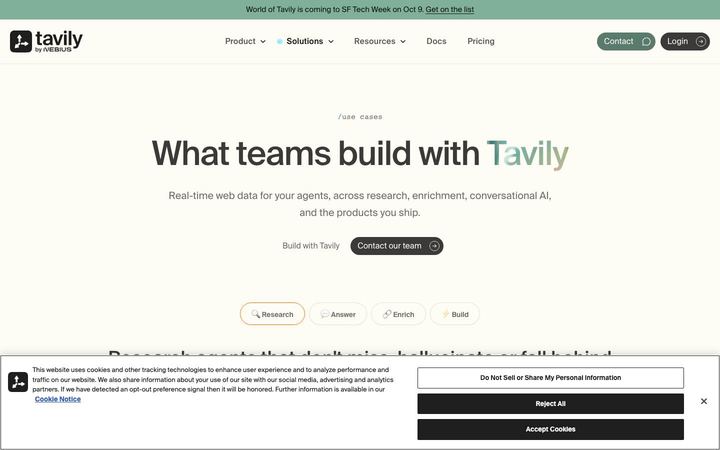
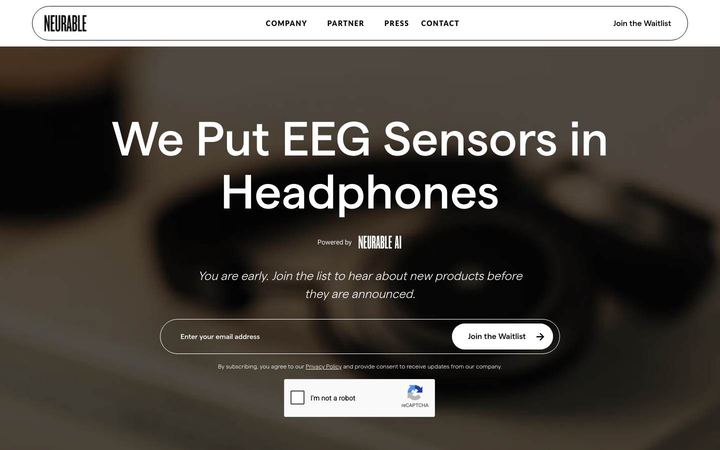
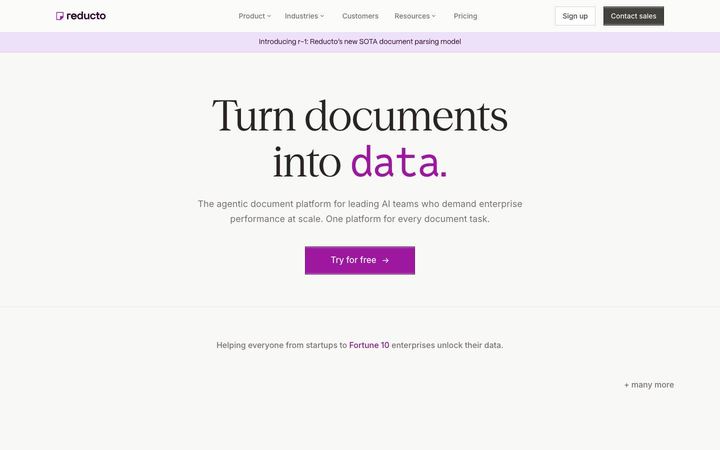
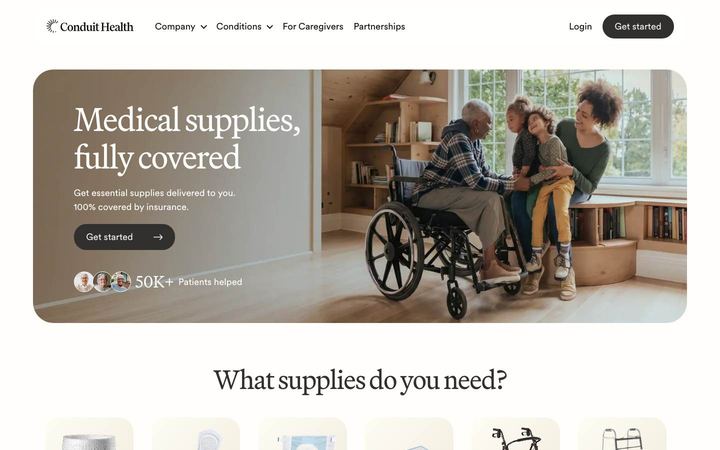
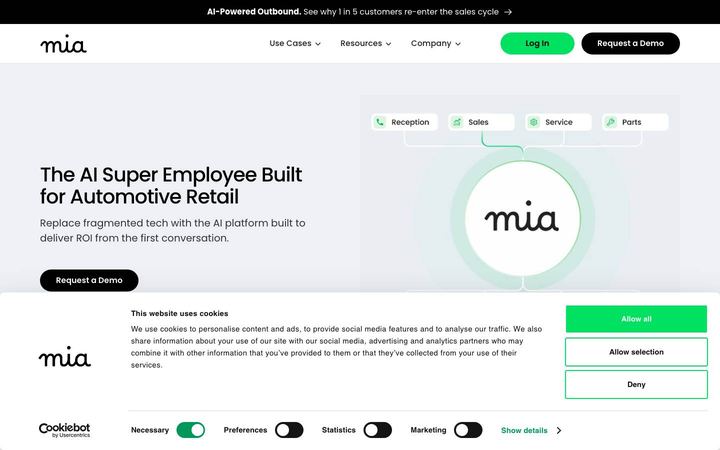
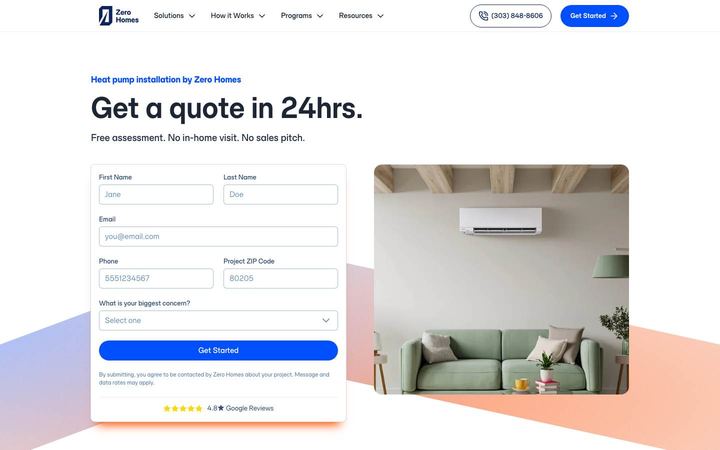
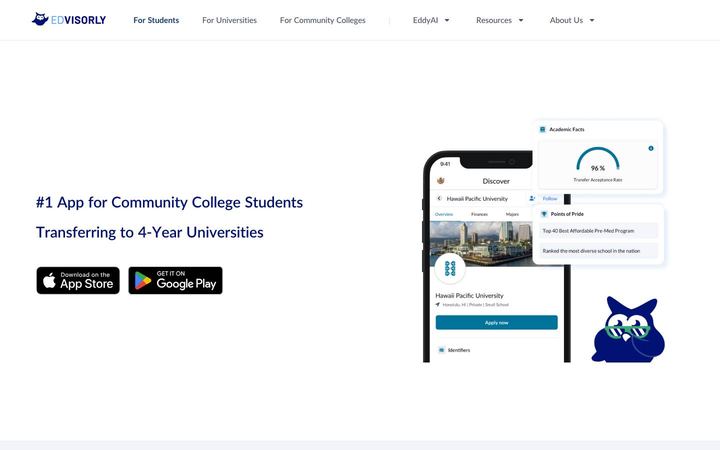
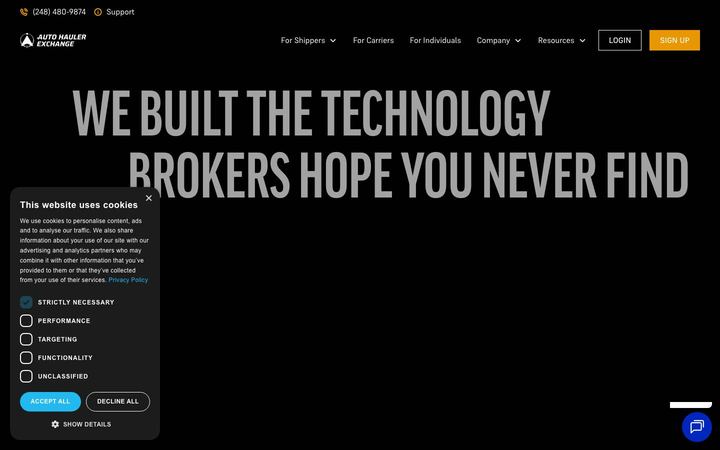
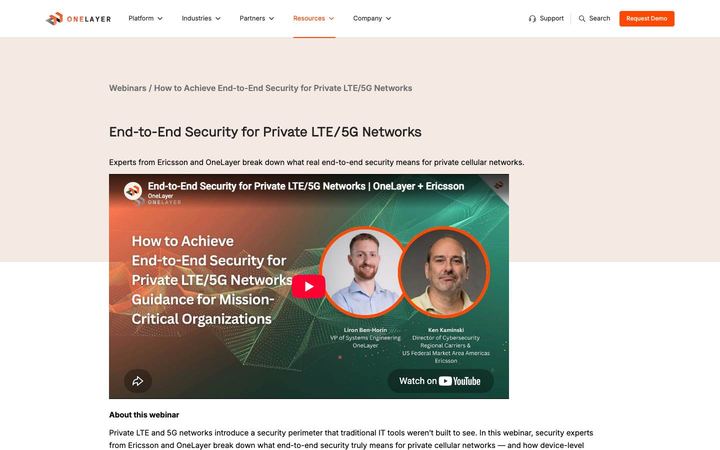
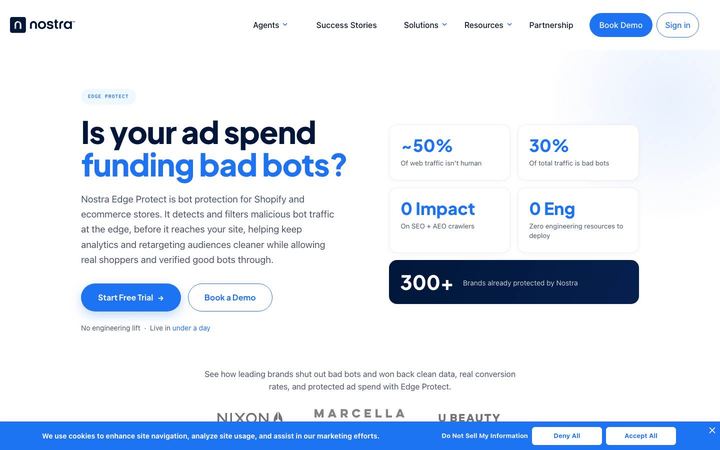
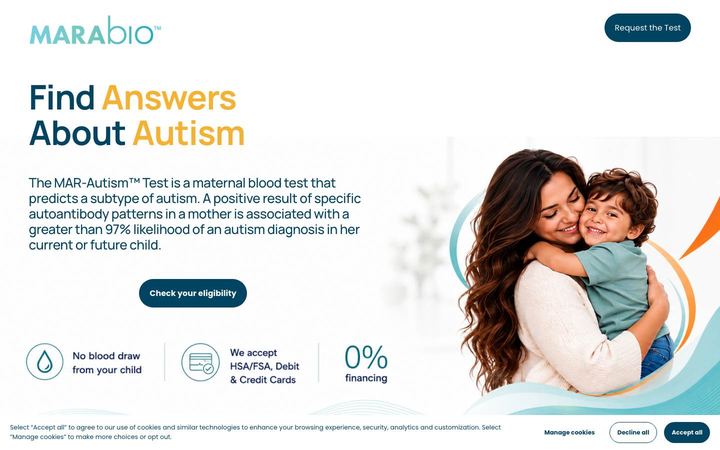
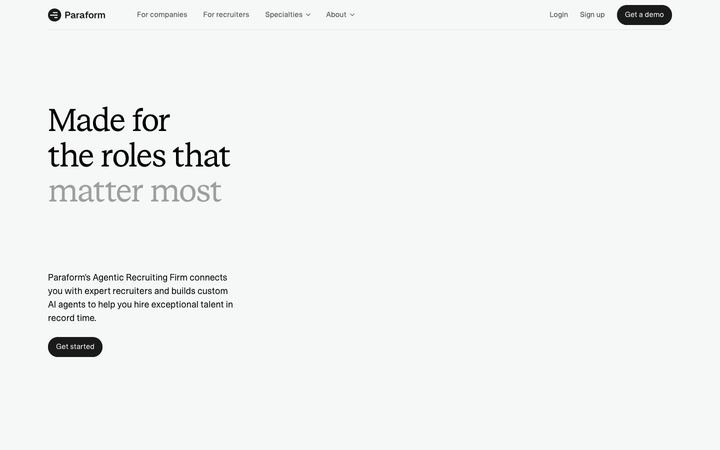
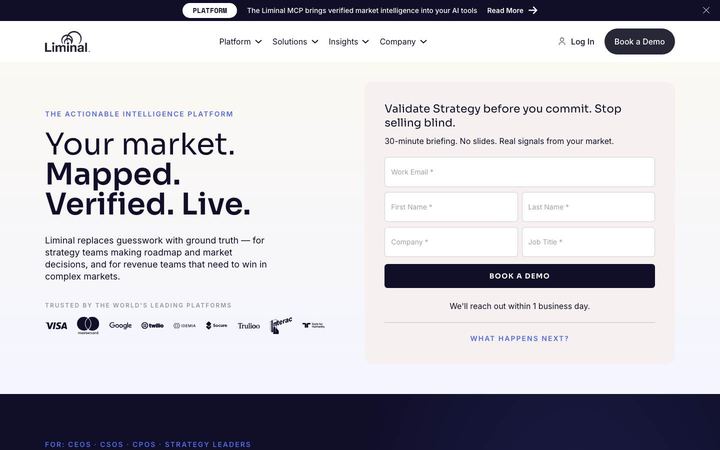
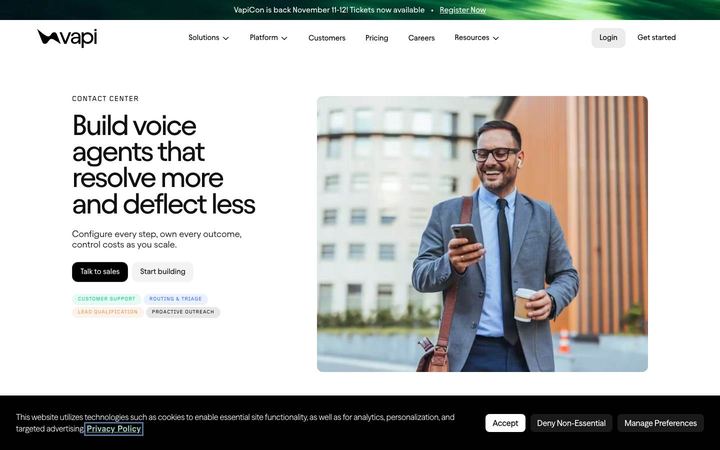
60 landing pages behind these ads
The companies that look like they are running an account, not a campaign
No public library shows spend or results, so nobody can tell you which of these companies is winning. What the libraries do show is whether an account is being run or just switched on. We scored each of the 1,062 advertisers on six things you can see from outside:
- An ad that has been serving for more than six months, which nobody pays for if it does not work
- Ads on two or more platforms
- Five or more different creatives live at once, which means they are testing
- Clicks going to a page built for the campaign, not the homepage
- Tracking tags on the destination links
- Something new launched in the last 60 days
The median advertiser shows 2 of the six. 25.2% show four or more, and those 268 companies are the "best-run accounts" referred to below. This measures the way an account is run, not how well it performs, and we will not pretend otherwise.
The distance between them and the rest is not subtle. The best-run accounts keep a median of 44 ads live from 29 different creatives. Everyone else: 6 ads from 4 creatives. Seven times the volume and seven times the testing.
What is striking is how little their creative differs. 14.8% of the best-run accounts' images show the product interface against 12% for everyone else, and customer logos appear in 2.9% against 2.7%. The one real gap is comparison ads, which show up in the best-run accounts and almost nowhere else. Whatever separates these companies, it is not that they make prettier ads.
The clearest difference is where the click lands. 36% of the rest of the field use a LinkedIn lead form as their main destination against 17.3% of the best-run accounts, and the best-run accounts send 42.4% of their clicks to a page of their own. That is the only way the visit reaches your analytics, your retargeting and your CRM.
The playbook
Everything above, turned into things you can do this week. Each one is here because the data shows most of your peer group is not doing it.
- Put LinkedIn first, not last. More US B2B Series A companies advertise on LinkedIn than on Google, and 14.7% use it as their only channel. If you are waiting until you are bigger, your competitors are already there.
- Ask for something. 69.9% of these ads state no offer. Pick one thing per campaign: a demo, a trial, a guide, a seat at a webinar. An ad with no ask is a brand impression you paid performance prices for.
- Put one concrete thing in the picture. 69.9% of these ads contain no product shot, no named customer, no logo wall and no number. A screenshot and a single figure puts you ahead of two thirds of your peer group.
- Use your customers. Testimonials are 3.6% of ads and customer results 1.6%. Only 2.3% of ad copy names a customer. One recognisable logo and one real number will make your ad the most credible thing in the feed.
- Show the product. Only 14.1% of these ads show the interface at all. B2B buyers want to see the thing they would be buying, and most of your peer group is not showing it to them.
- Build the page. 22.6% of advertisers send paid clicks to their homepage and 28.1% never leave LinkedIn at all, while 52.1% of landing pages put proof above the fold. A page that repeats the ad's headline, strips the navigation and shows one proof point beats a homepage every time.
- Put the page somewhere a marketer can edit it. The pages that get iterated are on Webflow, Framer, HubSpot or an equivalent. If changing a headline needs a pull request, it will not happen.
- Tag your links. Only 15.5% of these advertisers put tracking on the destination. Without it you cannot tell your board which channel worked.
- Run more than one creative. The best-run accounts keep 29 different creatives live; the rest keep 4. You cannot learn anything from one ad.
- Leave the winners alone. 31.9% of advertisers have an ad that has run more than six months. Those are the ads paying for everything else.
- Say something other than AI. 41% of these ads mention it. It is no longer a differentiator; it is the wallpaper.
Method and limits
The company list is every funding round Crunchbase records as a Series A announced between September 1, 2024 and August 31, 2026. We kept the companies headquartered in the United States whose product sells to other businesses (classified from the company description, hand-checked on a 100-company sample), with a live website, that we were able to check against all three ad libraries: 2,010 companies. Every company here has raised at least a Series A; this is not every US B2B company that has ever raised one.
How we got the ads. The Google Ads Transparency Center, the Meta Ad Library and the LinkedIn Ad Library, pulled with Apify scrapers, in September 2026. A company counts as advertising on Google when its own domain appears in the Transparency Center and an ad was shown in the last twelve months; on Meta when a page provably theirs is running ads; on LinkedIn when an ad in the library is provably theirs. That produced 35,132 ads.
How we read the creative. 800 ad images from 456 companies were labelled by a vision model against a fixed list of B2B ad types and offers. Percentages in that section are of the labelled sample, not of all ads.
How we read the landing pages. We followed the destination of every ad where the library exposes one, including shortened links, and rendered 119 of those pages in a real browser at desktop and mobile size, then read the page structure from the DOM. Pages are classified as built-for-the-campaign from the URL path and from a stripped navigation. Google's library hides the URL path, so this part of the study is what LinkedIn and Meta expose.
What this cannot tell you. No public ad library discloses spend, impressions, clicks or conversions. Nothing here says an ad worked. The "best-run accounts" score measures visible habits, not results. All of it is one snapshot: a company that ran ads last quarter and paused reads here as not advertising.
Built by Adside. We run paid ads for companies at exactly this stage, which is why we had the data lying around. The full Series A study covers all 4,930 companies worldwide.